


Demographic Patterns in Canadians’ Arts Participation in 2016

Overall arts attendance rates are high for many demographic groups
Demographic Patterns in Canadians’ Arts Participation in 2016, the 48th report in the Statistical Insights on the Arts series from Hill Strategies Research, highlights demographic patterns in arts participation in Canada, based on the survey of arts participation with the largest sample size (9,844 respondents) – Statistics Canada’s 2016 General Social Survey (Canadians at Work and Home).
The report examines 11 indicators of arts participation, including eight arts attendance activities, two summary indicators of arts attendance, as well as participation in making or performing art.
The broadest indicator of arts attendance (which includes all eight arts activities) shows that the arts appeal to a large majority of Canadians in all demographic groups.
 The report examines the influence of a wide range of demographic factors on arts participation rates, including education, family income, language, sex, age, and many others.
This summary highlights areas where there are patterns in arts participation, that is, areas where there appear to be demographic influences across many different arts participation activities.
Education is the strongest pattern in arts participation
The strongest pattern in arts participation found in the analysis is that higher education equates to higher arts participation. In fact, education is the only demographic factor that is important for all 11 indicators of arts participation.
Partial patterns in arts attendance
Patterns of higher attendance rates were found for many demographic groups, including women, youth, Canadians with high family income, and non-religious Canadians. However, there is at least one pattern breaker for each of these groups (i.e., an arts activity that does not follow the general pattern of higher attendance rates):
- Women tend to have higher arts attendance rates than men, except for cultural festivals. Arts attendance differences between women and men tend to be small but consistent across many activities.
- Youth 15 to 24 years of age tend to have higher arts attendance rates than older respondents, except for classical music and other kinds of cultural performances.
- Canadians with higher family income levels tend to have higher arts attendance rates than other Canadians, except for heritage or ethnic performances and other kinds of cultural performances.
- Canadians without a religious affiliation tend to have higher arts attendance rates than Canadians with a religious affiliation, except for one category (other kinds of cultural performances).
Many groups have similar overall arts attendance rates but different rates for certain arts activities
Many demographic groups have similar overall arts attendance rates, including racialized and non-racialized Canadians (based on a survey question related to respondents’ “racial or cultural groups”), Indigenous and non-Indigenous respondents, as well as immigrant and non-immigrant respondents. However, for each of these demographic groups, there are differences in the attendance rates for some of the eight arts activities.
Racialized and non-racialized Canadians
Overall arts attendance rates are similar between racialized (88%) and non-racialized Canadians (86%). However, racialized respondents have higher attendance rates than non-racialized respondents at cultural festivals, and other kinds of cultural performances but lower attendance rates at theatre and pop music performances. In addition, attendance rates for racialized Canadians are higher for heritage or ethnic performances, a question that included specific wording related to dance, theatre, or music performances including “Aboriginal Peoples, Chinese or Ukrainian”. Racialized Canadians have lower attendance rates than non-racialized respondents at theatre and popular music performances.
Indigenous and non-Indigenous people
For Indigenous respondents, the overall arts attendance rate is similar to that for non-Indigenous respondents (84% and 86%, respectively). Indigenous respondents have much higher attendance rates than non-Indigenous respondents at heritage or ethnic performances, which, as noted above, specifically referred to performances involving “Aboriginal Peoples”. On the other hand, Indigenous respondents have lower attendance rates than non-Indigenous respondents at public art galleries, classical music performances, and cultural festivals.
Immigrant and non-immigrant Canadians
Immigrant Canadians have a similar overall arts attendance rate to non-immigrants (84% and 87%, respectively). Immigrant Canadians have much higher attendance rates than non-immigrant respondents at heritage or ethnic performances and other kinds of cultural performances but lower attendance rates at theatre and popular music performances.
Where there are differences between recent and earlier immigrants, the pattern is for recent immigrants (i.e., between 2006 and 2016) to have higher attendance rates. For example, the overall arts attendance rate is 90% for recent immigrants and 82% for earlier immigrants. There are similar differences for five of the eight arts activities.
Other demographic groups
The pattern of similar overall arts attendance rates but differences for some arts activities is also the case for other demographic groups, such as speakers of different languages as well as Canadians with or without children at home.
Making or performing art: Some patterns differ from arts attendance
Unlike the overall arts attendance pattern, participation in making or performing art is very similar to the national average (50%) for Canadians of different family income levels. While urban respondents tend to have higher arts attendance rates than rural respondents, the two groups have similar participation rates in making or performing art.
Studies that focus exclusively on arts attendance would miss these nuances in arts participation.
Intersectional analysis of arts participation by women and racialized Canadians
The report provides a rare intersectional analysis of arts participation by women and racialized Canadians.
For women, the report examines the arts participation rates of women who are racialized, are immigrants, or have particularly low or high income levels. Variables such as disability and sexual orientation could also be part of an intersectional analysis, but they are not available in the dataset.
There are no overarching arts participation patterns for racialized women, compared with either non-racialized women or racialized men. For example, the overall arts attendance rate is similar for racialized and non-racialized women (90% and 87%, respectively) as well as between racialized women and racialized men (90% and 86%, respectively). There are also similar attendance rates at classical music performances (19% for racialized women, 16% for non-racialized women, and 18% for racialized men).
Similarly, there are no overarching arts participation patterns for immigrant women, compared with either non-immigrant women or immigrant men. The overall arts attendance rate is 84% for both immigrant women and immigrant men, and 88% for non-immigrant women.
There are much larger differences in arts participation rates between those at the highest and lowest family income levels. For example, the overall arts attendance rate is 95% for women at the highest family income level (more than $125,000) but only 77% for women with family incomes below $25,000. (Men with low family incomes also have a relatively low overall arts attendance rate: 77%.)
Data reliability limits the intersectional analysis for racialized Canadians to racialized immigrants and non-immigrants, an analysis that showed no consistent patterns.
Tables appended to this report provide full details about participation in these activities, as well as movie theatres and the catch-all category of “other kinds of cultural performances”.

The previous report in the Statistical Insights on the Arts series found that virtually all Canadians (15 or older) participated in some type of arts, culture, or heritage activity in 2016 (100%, or 99.5% if rounded to one decimal place). The report recognized that this is a very broad indicator, including, for example, someone who read a newspaper, watched a movie, or listened to music at any point in 2016.
This report focuses on demographic patterns in a smaller number of arts activities, including:
- Attending arts performances or festivals
- Visiting public art galleries
- Making or performing art
The report includes an analysis of 11 indicators of arts participation, including eight arts attendance activities, two summary indicators of arts attendance, as well as participation in making or performing art.
The data are drawn from Statistics Canada’s General Social Survey of 2016, an in-depth survey of Canadians 15 years of age or older. The survey asked Canadians about their participation during the previous 12 months.
Trends in participation are not included in this report because of changes in the wording of many arts participation questions and most demographic questions over time.
The 2016 General Social Survey reached 9,844 Canadians who reside in one of the ten provinces,[1] including telephone and online respondents.[2]
Demographic factors
The report examines the influence of a wide range of demographic factors on arts participation rates:
- Women and men
- Indigenous and non-Indigenous people
- Racialized and non-racialized Canadians (based on a survey question related to respondents’ “racial or cultural groups”)
- Canadians with different mother tongues (Anglophones, Francophones, and speakers of non-official languages)
- Francophones outside Quebec (but corresponding statistics for Anglophones in Quebec are not reliable due to the low number of survey respondents)
- People residing in rural or urban areas
- Different age groups
- Immigrants and non-immigrants
- Canadians with different education levels
- Canadians with different family income levels
- People with or without children at home
- People with or without a religious affiliation
Variables such as disability, deafness, and sexual orientation are not available in the dataset and are therefore excluded from the analysis in this report.
Appendix 2 provides details of the demographic questions in the 2016 General Social Survey that are highlighted in this report.
In general, the report highlights differences between groups that are five percentage points or higher. Smaller differences would generally fall within the survey’s margin of error. (The general rule of highlighting differences that are at least five percentage points is loosened somewhat for arts activities with relatively low attendance rates.)
The summary to this report highlights areas where there are patterns in arts participation, that is, areas where there appear to be demographic influences across many different arts participation activities.
The report provides an intersectional analysis of arts participation by women and racialized Canadians, including additional demographic elements for which reliable data are available. Intersectionality is a concept that “recognizes peoples’ identities and social positions are shaped by multiple factors. Among others, a person’s age, disability, ethnicity, gender identity, religion, sexual orientation, and socioeconomic background contribute towards their unique experiences and perspectives”[3] including their experiences of, and barriers to, arts participation.
In this report, the arts participation rates of women are cross-tabulated by members of racialized groups (or not), immigrants and non-immigrants, and women with lower and higher income levels. There are at least 450 survey respondents for each of these cross-tabulations. On the other hand, an intersectional analysis of the arts participation rates of female Indigenous respondents would not be reliable (fewer than 200 respondents).
The arts participation rates of racialized Canadians are cross-tabulated for immigrants and non-immigrants (at least 384 respondents for each breakdown). Cross-tabulations of racialized respondents by education or income would not be reliable (fewer than 200 respondents in many breakdowns).
Arts participation questions in 2016
The 2016 General Social Survey asked Canadians about their arts attendance, including:
- Visiting a public art gallery or art museum (including attendance at special art exhibits)
- Attending a live performance such as drama, musical theatre, dinner theatre, comedy
- Attending a popular music performance
- Attending a symphonic or classical music performance
- Attending a cultural or artistic festival (such as film, jazz, folk, or comedy)
- Attending a performance of cultural or heritage music, theatre or dance (e.g. Aboriginal Peoples, Chinese, Ukrainian)
- Attending any other kind of cultural performance
- Watching a movie at a movie theatre
This report combines the responses to some of the GSS questions into key indicators such as overall arts attendance and attendance at arts performances or festivals. An analysis of demographic factors in attendance at many different arts activities is also provided. While not a focus in the text of this report, statistics related to attendance in the catch-all category of “other cultural performances” and attendance at movie theatres are included in the detailed tables in Appendix 1.
The 2016 GSS did not contain questions specifically related to dance or opera performances, as well as book or poetry readings. These activities might have been included by respondents in “other kinds of cultural performances”.
For the first time, the 2016 GSS asked respondents whether they made or performed art, phrased in the survey as “active participation in” the following eight activities:
- “Making music (e.g.., singing, playing an instrument or remixing music)
- Theatre (e.g.., acting, storytelling or comedy)
- Audio-visual and interactive media (e.g.., making films, animation or videos)
- Dance (e.g.., socially, in a performance or choreography)
- Visual arts (e.g.., painting, photography, sculpture or drawing)
- Crafts (e.g.., needlework, scrapbooking, woodwork, metalwork or pottery)
- Writing (e.g.., poetry, plays, stories, editorials and reviews)”[4]
- Other participatory activities (specified by respondents)
Important elements of the General Social Survey
While the survey included questions related to the frequency of participation, in general, individuals are counted only once in each activity regardless of how many times they participated in the activity. As such, this report provides estimates of the participation rates of Canadians in cultural activities, not estimates of overall attendance. The survey questions were not specific enough to derive reliable estimates of overall attendance.
The data include attendance of Canadians while travelling out of province or out of the country and exclude attendance by residents of other countries while travelling in Canada. For example, the art gallery attendance statistics represent the number and proportion of Canadians who visited at least one art gallery (anywhere) during the survey year, not the total visits made to Canadian art galleries.
The statistics in this report have been adjusted for non-response. This means that responses of “don’t know” or “not stated” are excluded from the results. The implicit assumption is that those who did not complete the survey or respond to a specific question participated in an activity in the same proportion as those who did respond.
Organization of the report
The remaining sections of this report are organized by type of activity:
- Overall arts attendance
- Arts attendance excluding movie theatres
- Public art gallery attendance
- Attendance at live theatre or comedy
- Classical music attendance
- Popular music attendance
- Heritage or ethnic performance attendance
- Attendance at artistic or cultural festivals
- Making or performing art
- Appendix: Detailed tables on demographic factors in arts participation

Nearly nine in ten Canadians attended an arts activity in 2016 (86% of the population 15 or older). Arts attendance includes art galleries (39%), arts performances or festivals (68%), and movie theatres (71%). Further details, including a breakdown of the six activities within “arts performances or festivals”, are provided in Figure 1.

An analysis of demographic factors in overall arts attendance shows that many demographic groups are very similar to the national average (86%):
- Women (87%) and men (85%)
- Indigenous respondents (84%) and non-Indigenous respondents (86%)
- Canadians from racialized groups (88%) and those not from racialized groups (86%)
- Immigrant respondents (84%) and non-immigrant respondents (87%). However, the arts attendance rate is higher for recent immigrants (90% for those arriving between 2006 and 2016) than earlier immigrants (82% for those arriving before 2006).
- Canadians with children at home (89%) and those without children at home (85%)
Figure 2 highlights these similarities.
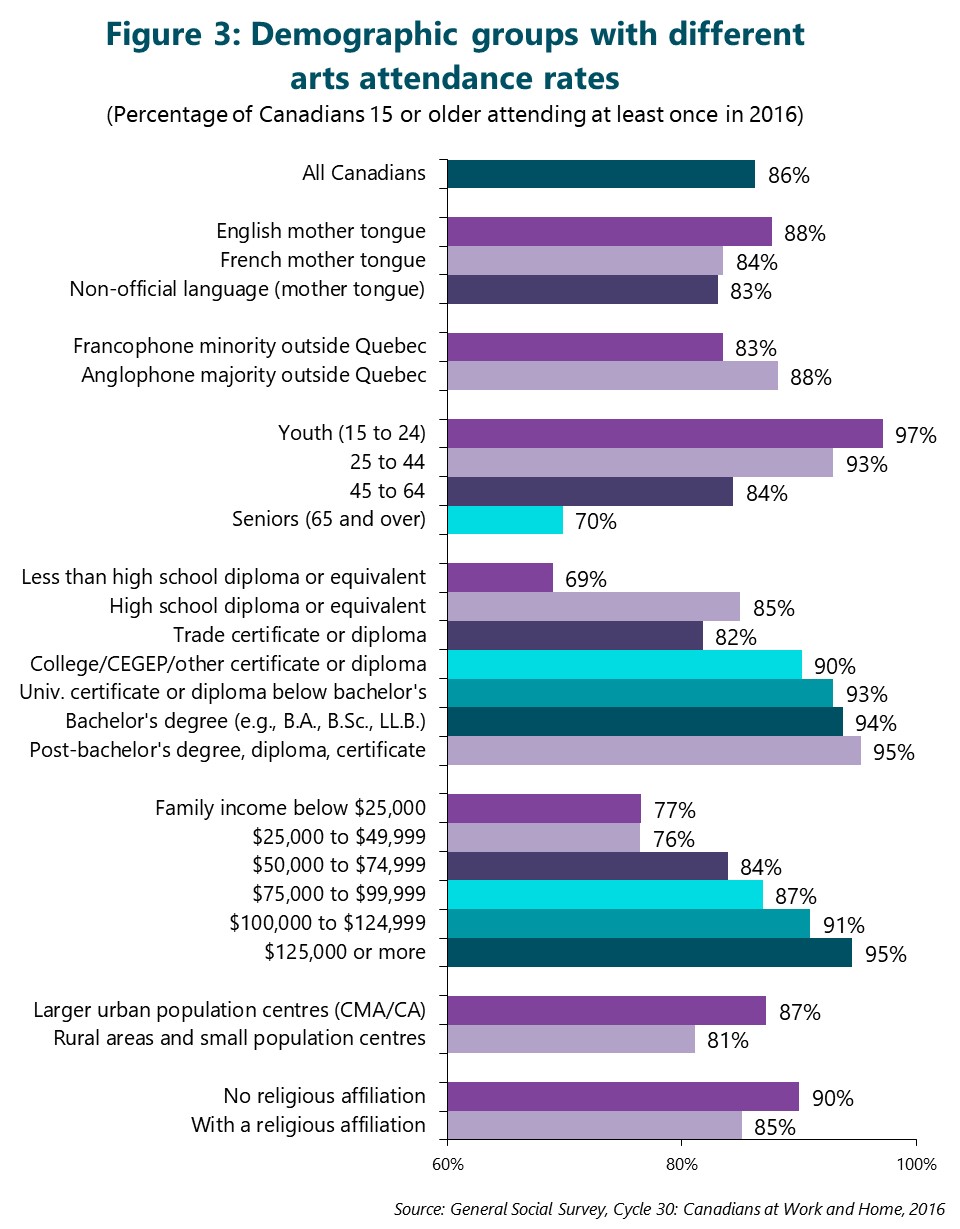
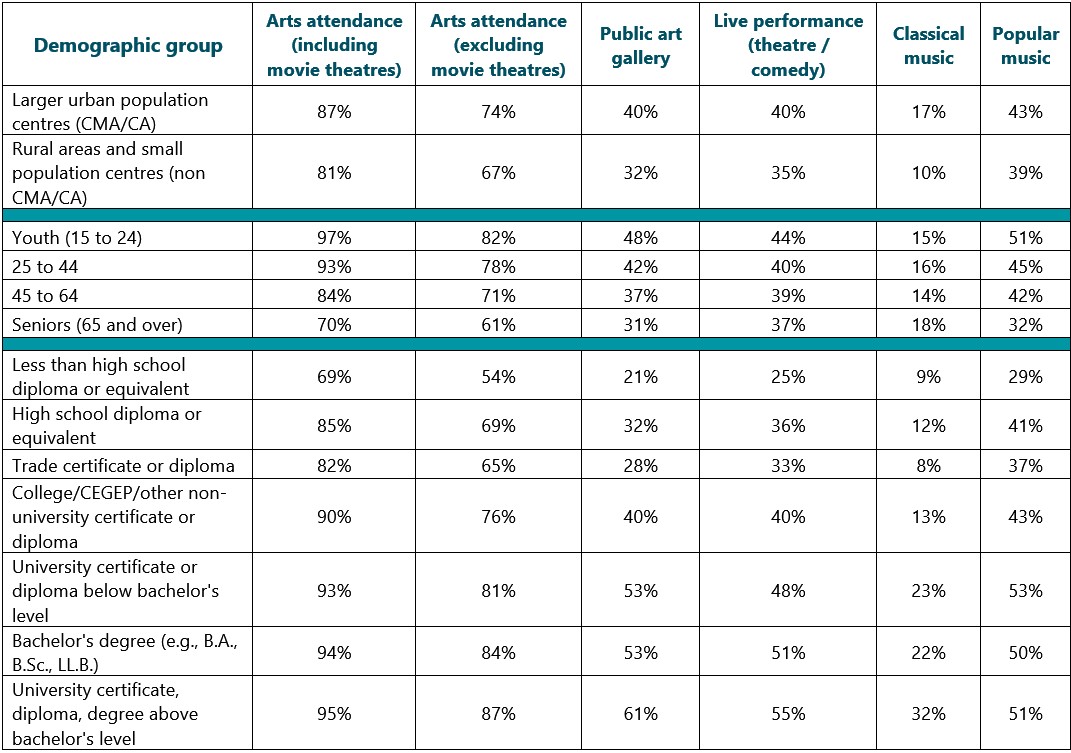
 Arts attendance rates are higher for Canadian youth (almost all of whom attended an arts activity in 2016), the Anglophone majority outside of Quebec, Canadians with higher education or income levels, those residing in larger urban centres, and those without a religious affiliation:
- Canadians with English as their maternal language (88%), compared with Francophones (84%) and speakers of non-official languages (83%)
- The Anglophone majority outside of Quebec (88%), compared with Francophones outside of Quebec (83%)
- Youth between 15 and 24 years of age (97%) and Canadians between 25 and 44 (93%), compared with those between 45 and 64 (84%) and seniors 65 and over (70%).
- Canadians with higher levels of formal education:
- 95% for those with a university certificate, diploma, degree above the bachelor’s level
- 94% for those with a bachelor’s degree (e.g. B.A., B.Sc., LL.B.)
- 93% for those with a university certificate or diploma below the bachelor’s level
- 90% for those with a college, CEGEP, or other non-university certificate or diploma
- 82% for those with a trade certificate or diploma
- 85% for those with a high school diploma or a high school equivalency certificate
- 69% for those with less than a high school diploma or its equivalent
- Canadians with higher family income levels:
- 95% for those with family incomes of $125,000 or more
- 91% for those between $100,000 and $124,999
- 87% for those between $75,000 and $99,999
- 84% for those between $50,000 and $74,999
- 76% for those between $25,000 and $49,999
- 77% for those below $25,000
- Respondents residing in larger urban population centres (87%) compared with respondents residing in rural areas and small population centres (81%)
- Canadians without a religious affiliation (90%), compared with those with a religious affiliation (85%)
Figure 3 presents those demographic groups with a difference of at least 5% in the overall arts attendance rate.
Arts attendance by women and racialized respondents
As noted above, the overall arts attendance rate for women is 87%. An intersectional look at women’s arts attendance rates shows that:
- Racialized women have similar arts attendance rates as non-racialized women (90% vs. 87%).
- Immigrant women are about as likely as non-immigrant women to attend the arts (84% vs. 88%).
- Women with lower family income levels have much lower arts attendance rates than higher-income women (77% of women with family incomes below $25,000 and 79% of women with family incomes between $25,000 and $49,999, compared with 92% of women with family incomes between $100,000 and $124,999 and 95% of women with family incomes of $125,000 or more).
Consistent with the overall finding of similar arts attendance rates between women (87%) and men (85%), women in all demographic groups have similar arts attendance rates as men in the same groups.
Racialized respondents are about as likely (88%) as non-racialized respondents (86%) to attend the arts. An intersectional analysis of racialized respondents’ arts attendance rates shows that:
- Racialized immigrants have similar arts attendance rates as non-racialized immigrants (85% vs. 83%).
- Racialized non-immigrants are more likely than non-racialized non-immigrants to attend the arts (92% vs. 86%).
An intersectional analysis for racialized respondents by income is not possible, given the small number of survey respondents in each income and education category (fewer than 250 respondents in each).

In 2016, about three-quarters of Canadians attended an arts activity, excluding movie theatres (73% of the population 15 or older).[5]
The analysis of demographic factors in arts attendance excluding movie theatres is very similar to the analysis for arts attendance including movie theatres. As shown in Figure 4, the arts attendance rate, excluding movie theatres, is very similar to the national average (73%) for many demographic groups:
- Indigenous respondents (72%) and non-Indigenous respondents (73%)
- Canadians from racialized groups (74%) and those not from racialized groups (73%)
- Immigrant respondents (70%) and non-immigrant respondents (74%). However, the arts attendance rate is much higher for recent immigrants (79% for those arriving between 2006 and 2016) than earlier immigrants (67% for those arriving before 2006).
- Canadians with English as their maternal language (74%), Francophones (70%), and speakers of non-official languages (70%)
- Canadians with children at home (74%) and those without children at home (72%)

Arts attendance rates are higher for women, Canadian youth, the Anglophone majority outside of Quebec, Canadians with higher education or income levels, those residing in larger urban centres, and those without a religious affiliation:
- Women (75%) compared with men (70%)
- Youth between 15 and 24 years of age (82%) and Canadians between 25 and 44 (78%), compared with those between 45 and 64 (71%) and seniors 65 and over (61%).
- The Anglophone majority outside of Quebec (75%), compared with the Francophone minority outside of Quebec (70%)
- Canadians with higher levels of formal education:
- 87% for those with a university certificate, diploma, degree above the bachelor’s level
- 84% for those with a bachelor’s degree (e.g. B.A., B.Sc., LL.B.)
- 81% for those with a university certificate or diploma below the bachelor’s level
- 76% for those with a college, CEGEP, or other non-university certificate or diploma
- 65% for those with a trade certificate or diploma
- 69% for those with a high school diploma or a high school equivalency certificate
- 54% for those with less than a high school diploma or its equivalent
- Canadians with higher family income levels:
- 81% for those with family incomes of $125,000 or more
- 79% for those between $100,000 and $124,999
- 73% for those between $75,000 and $99,999
- 69% for those between $50,000 and $74,999
- 62% for those between $25,000 and $49,999
- 66% for those below $25,000
- Respondents residing in larger urban population centres (74%), compared with respondents residing in rural areas and small population centres (67%)
- Canadians without a religious affiliation (77%), compared with those with a religious affiliation (72%)
Figure 5 presents those demographic groups with a difference of at least 5% in the arts attendance rate (excluding movie theatres).

Arts attendance (excluding movie theatres) by women and racialized respondents
As noted above, the arts attendance rate (excluding movie theatres) is 75% for women. An intersectional look at women’s arts attendance rates (excluding movie theatres) shows that:
- Racialized women have similar arts attendance rates to non-racialized women (78% and 75%).
- Immigrant women are less likely than non-immigrant women to attend the arts (71% vs. 77%).
- Women with lower family income levels have much lower arts attendance rates than women with higher income (67% of women with family incomes below $25,000 and 65% of women with family incomes between $25,000 and $49,999, compared with 80% of women with family incomes between $100,000 and $124,999 and 84% of women with family incomes of $125,000 or more).
Consistent with the overall finding of higher arts attendance rates for women (75%) than men (70%), attendance is more common among both racialized and non-racialized women than men (78% for racialized women vs. 70% for racialized men; 75% for non-racialized women vs. 70% for non-racialized men).
This finding is not consistent in all other demographic groups, however. Immigrant women and men are equally likely to attend an arts event, excluding movie theatres (71% and 69%, respectively). Non-immigrant women are more likely than non-immigrant men to attend an arts event, excluding movie theatres (77% vs. 71%).
The arts attendance rate is similarly low for women and men with family incomes below $25,000 (67% and 65%). However, the arts attendance rate is higher for women than men with family incomes between $25,000 and $49,999 (65% vs. 58%).
At higher income levels, the arts attendance rate is similar for women and men with family incomes between $100,000 and $124,999 (80% and 77%). However, the arts attendance rate is higher for women than men with family incomes of $125,000 or more (84% vs. 79%).
Racialized respondents are as likely (74%) as non-racialized respondents (73%) to attend the arts, excluding movie theatres. An intersectional analysis of the arts attendance rates of racialized respondents[6] shows that:
- Racialized immigrants have similar arts attendance rates as non-racialized immigrants (68% vs. 71%).
- Racialized non-immigrants are more likely than non-racialized non-immigrants to attend the arts (83% vs. 73%).

In 2016, 39% of Canadians 15 years of age or older visited a public art gallery or art museum, including attendance at special art exhibits.[7]
The attendance rate is very similar to the national average (39%) for some demographic groups:
- Women (41%) and men (37%)
- Canadians from racialized groups (42%) and those not from racialized groups (39%)
- Immigrant respondents (41%) and non-immigrant respondents (39%). However, the art gallery attendance rate is much higher for recent immigrants (49% for those arriving between 2006 and 2016) than earlier immigrants (38% for those arriving before 2006).
- The Anglophone majority outside of Quebec (41%), compared with the Francophone minority outside of Quebec (40%)
- Canadians with children at home (38%) and those without children at home (40%)
Figure 6 depicts these similarities.
 There are differences of at least 5% in the art gallery attendance rate by Indigeneity, age, maternal language, education, family income, urban and rural respondents, and religious affiliation (see Figure 7), including higher attendance rates for:
- Non-Indigenous respondents (39%) than Indigenous respondents (31%).
- Anglophones (40%) and speakers of non-official languages (39%) than Francophones (34%).
- Youth between 15 and 24 years of age (48%) and Canadians between 25 and 44 (42%) than those between 45 and 64 (37%) and seniors 65 and over (31%).
- Canadians with higher levels of formal education:
- 61% for those with a university certificate, diploma, degree above the bachelor’s level
- 53% for those with a bachelor’s degree (e.g. B.A., B.Sc., LL.B.)
- 53% for those with a university certificate or diploma below the bachelor’s level
- 40% for those with a college, CEGEP, or other non-university certificate or diploma
- 28% for those with a trade certificate or diploma
- 32% for those with a high school diploma or a high school equivalency certificate
- 21% for those with less than a high school diploma or its equivalent
- Canadians with higher family income levels:
- 48% for those with family incomes of $125,000 or more
- 41% for those between $100,000 and $124,999
- 41% for those between $75,000 and $99,999
- 33% for those between $50,000 and $74,999
- 31% for those between $25,000 and $49,999
- 35% for those below $25,000
- Respondents residing in larger urban population centres (40%) than those residing in rural areas and small population centres (32%)
- Canadians without a religious affiliation (45%) than those with a religious affiliation (37%)

Art gallery attendance by women and racialized respondents
As noted above, the art gallery attendance rate is 41% for women. An intersectional look at women’s art gallery attendance rates shows that:
- Racialized women have higher art gallery attendance rates than non-racialized women (45% vs. 40%).
- Immigrant women are as likely as non-immigrant women to visit art galleries (42% and 41%).
- Women with lower family income levels have lower art gallery attendance rates than higher-income women (39% of women with family incomes below $25,000 and 35% of women with family incomes between $25,000 and $49,999, compared with 45% of women with family incomes between $100,000 and $124,999 and 49% of women with family incomes of $125,000 or more).
While the art gallery attendance rate is similar for women (41%) and men (37%), art gallery attendance is more common for racialized women (45%) than racialized men (38%). However, the attendance rate is similar between non-racialized women (40%) and non-racialized men (37%).
Immigrant women and men are similarly likely to visit an art gallery (42% for women and 39% for men). Non-immigrant women (41%) are more likely than non-immigrant men (36%) to visit a gallery.
The art gallery attendance rate is much higher for women with family incomes below $25,000 (39%) than men in the same income range (30%) and much higher for women with family incomes between $25,000 and $49,999 (35%) than men in the same income range (27%).
At higher income levels, the art gallery attendance rate is higher for women (45%) than men (37%) with family incomes between $100,000 and $124,999 but is similar for women (49%) and men (46%) with family incomes of $125,000 or more.
Racialized respondents are about as likely (42%) as non-racialized respondents (39%) to visit a public art gallery. An intersectional analysis of the art gallery attendance rates of racialized respondents[8] shows that:
- Racialized immigrants have lower art gallery attendance rates than non-racialized immigrants (38% vs. 45%).
- Racialized non-immigrants are much more likely than non-racialized non-immigrants to visit art galleries (48% vs. 38%).

In 2016, 40% of Canadians attended a live theatre or comedy performance (such as drama, musical theatre, dinner theatre, or comedy, excluding festivals).[9]
The theatre or comedy attendance rate is very similar to the national average (40%) for relatively few demographic groups:
- Indigenous respondents (36%) and non-Indigenous respondents (40%)
- The Anglophone majority outside of Quebec (45%), compared with the Francophone minority outside of Quebec (41%)
- Canadians with children at home (38%) and those without children at home (41%)
- Canadians without a religious affiliation (41%) and those with a religious affiliation (39%)
There are numerous demographic differences of at least 5% in the theatre or comedy attendance rate, many of which follow the overall patterns for arts attendance. As shown in Figure 8:
- Women are more likely to attend theatre or comedy performances than men.
- Youth between 15 and 24 are more likely to attend theatre or comedy performances than other age ranges.
- Theatre or comedy attendance increases significantly with education and income levels.
- Respondents in larger urban centres are more likely to attend than residents of rural areas and small population centres.
Some differences found in theatre or comedy attendance are not common in many other arts activities:
- Canadians from racialized groups are less likely to attend than those not from racialized groups (35% vs. 41%).
- Immigrant respondents are less likely to attend than non-immigrant respondents (33% vs. 42%). The theatre or comedy attendance rate is similarly low for both recent immigrants (34% for those arriving between 2006 and 2016) and earlier immigrants (32% for those arriving before 2006).
- Anglophones (46%) are much more likely to attend theatre or comedy performances than Francophones (32%) and speakers of non-official languages (also 32%).

Theatre or comedy attendance by women and racialized respondents
As noted above, the theatre or comedy attendance rate is 42% for women. An intersectional look at women’s theatre or comedy attendance rates shows that:
- Racialized women have lower theatre or comedy attendance rates than non-racialized women (36% vs. 44%).
- Immigrant women are much less likely than non-immigrant women to attend theatre or comedy performances (35% vs. 45%).
- Women with lower family income levels have much lower theatre or comedy attendance rates than higher-income women (rate of 30% for women with family incomes below $25,000 and 36% for women with family incomes between $25,000 and $49,999, compared with 45% for women with family incomes between $100,000 and $124,999 and 51% for women with family incomes of $125,000 or more).
While the theatre or comedy attendance rate is higher for women (43%) than men (37%), theatre or comedy attendance is similar between racialized women (36%) and racialized men (34%). However, theatre or comedy attendance is higher for non-racialized women (44%) than non-racialized men (38%).
Immigrant women and men are similarly likely to attend a theatre or comedy performance (35% of women and 31% of men). Non-immigrant women (45%) are more likely than non-immigrant men (39%) to attend theatre or comedy.
The theatre or comedy attendance rate is the same for women and men with family incomes below $25,000 (30% for each) but is much higher for women with family incomes between $25,000 and $49,999 (36%) than men in the same income range (28%).
At higher income levels, the theatre or comedy attendance rate is higher for women (45%) than men (39%) with family incomes between $100,000 and $124,999 but is similar for women (51%) and men (47%) with family incomes of $125,000 or more.
Racialized respondents are less likely (35%) than non-racialized respondents (41%) to attend a theatre or comedy performance. An intersectional analysis of the theatre or comedy attendance rates of racialized respondents[10] shows that:
- Racialized immigrants have a much lower theatre or comedy attendance rate than non-racialized immigrants (29% vs. 39%).
- Racialized non-immigrants have a higher theatre or comedy attendance rate than non-racialized non-immigrants (47% vs. 41%).

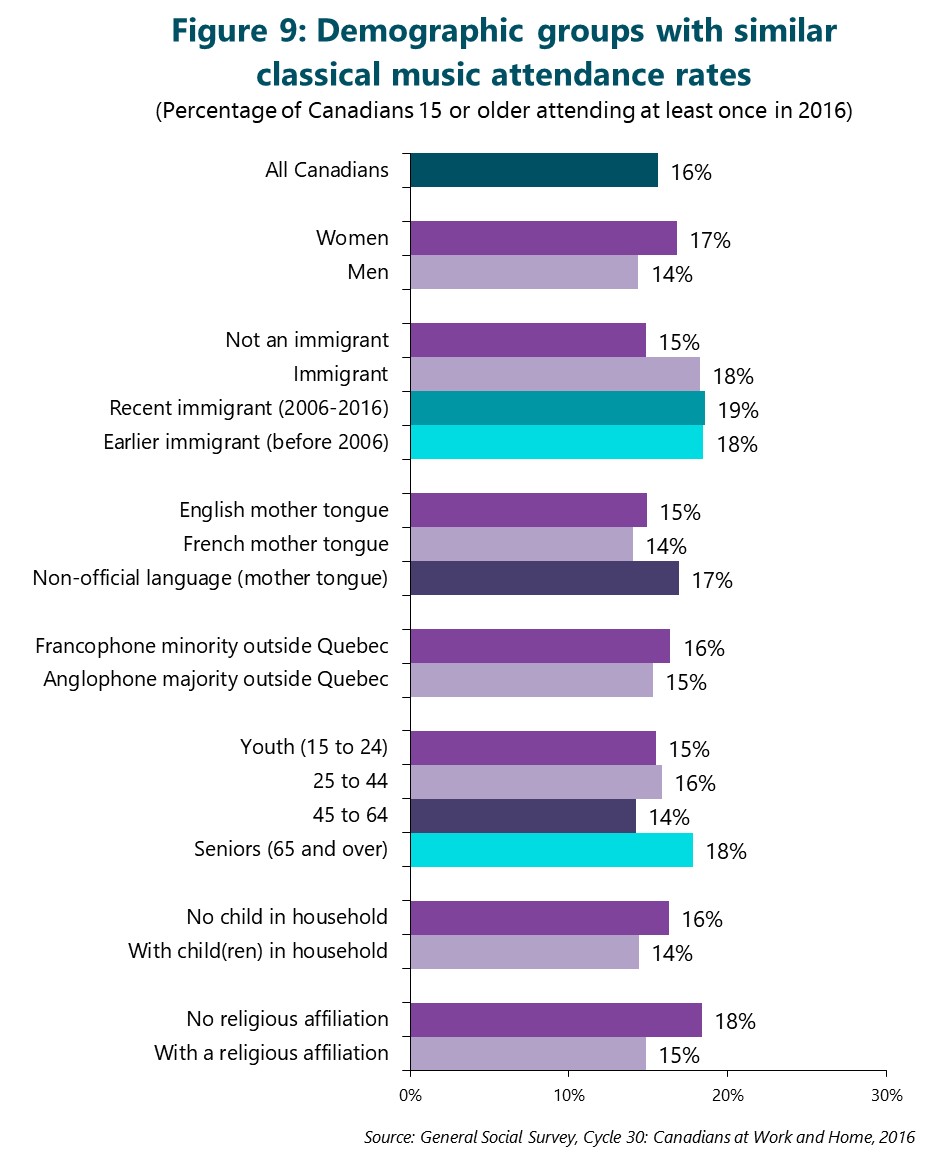
Classical music performances (excluding at festivals) were attended by 16% of Canadians 15 or older in 2016.[11]
The classical music attendance rate is within a 3% range for many demographic groups[12], as shown in Figure 9:
- Women (17%) and men (14%)
- Immigrant respondents (18%) and non-immigrant respondents (15%). The classical music attendance rate is similar for both recent immigrants (19% for those arriving between 2006 and 2016) and earlier immigrants (18% for those arriving before 2006).
- Anglophones (15%), Francophones (14%), and speakers of non-official languages (17%).
- The Anglophone majority (15%) and the Francophone minority outside of Quebec (16%)
- Different age groups, although the rate is somewhat lower for Canadians between 45 and 64 (14%) than seniors 65 or older (18%). (This differs from the overall pattern of higher attendance rates by Canadian youth.)
- Canadians with children at home (14%) and those without children at home (16%)
- Canadians without a religious affiliation (18%) and those with a religious affiliation (15%) (This differs from the overall pattern of much higher attendance rates by Canadians without a religious affiliation.)
The classical music attendance rate differs by 5% or more for relatively few demographic groups:
- Non-Indigenous respondents (16%), compared with Indigenous respondents (11%)
- Canadians with higher levels of education and income, compared with those with lower education or income levels
- Respondents residing in larger urban population centres (17%) and those residing in rural areas and small population centres (10%)
There is a moderate difference of 4% between Canadians from racialized groups (19%) and those not from racialized groups (15%).
Classical music attendance by women and racialized respondents
As noted above, the classical music attendance rate is 17% for women. An intersectional look at women’s classical music attendance rates shows that:
- Racialized women and non-racialized women have similar classical music attendance rates (19% and 16%).
- Immigrant women are more likely than non-immigrant women to attend classical music performances (21% vs. 16%).
- Women with lower family income levels have slightly lower classical music attendance rates than higher-income women (rate of 15% for women with family incomes below $25,000 and 14% for women with family incomes between $25,000 and $49,999, compared with 18% for women with family incomes between $100,000 and $124,999 and 19% for women with family incomes of $125,000 or more).
Consistent with the overall finding of a similar classical music attendance rate between women (17%) and men (14%), classical music attendance is similar between racialized women and men (19% and 18%) as well as between non-racialized women and men (16% and 13%).
Immigrant women are more likely to attend a classical music performance than immigrant men (21% of women vs. 16% of men). Non-immigrant women and men are similarly likely to attend classical music (16% and 14%).
The classical music attendance rate is very similar for women and men with family incomes below $25,000 (15% and 14%) and similar for women with family incomes between $25,000 and $49,999 (14%) and men in the same income range (11%).
At higher income levels, the classical music attendance rate is slightly higher for women (18%) than men (14%) with family incomes between $100,000 and $124,999 but is similar for women (19%) and men (18%) with family incomes of $125,000 or more.
Racialized respondents are slightly more likely (19%) than non-racialized respondents (15%) to attend a classical music performance. An intersectional analysis of the classical music attendance rates of racialized respondents[13] shows that:
- Racialized immigrants have a lower classical music attendance rate than non-racialized immigrants (16% vs. 22%).
- Racialized non-immigrants have a much higher classical music attendance rate than non-racialized non-immigrants (23% vs. 14%).

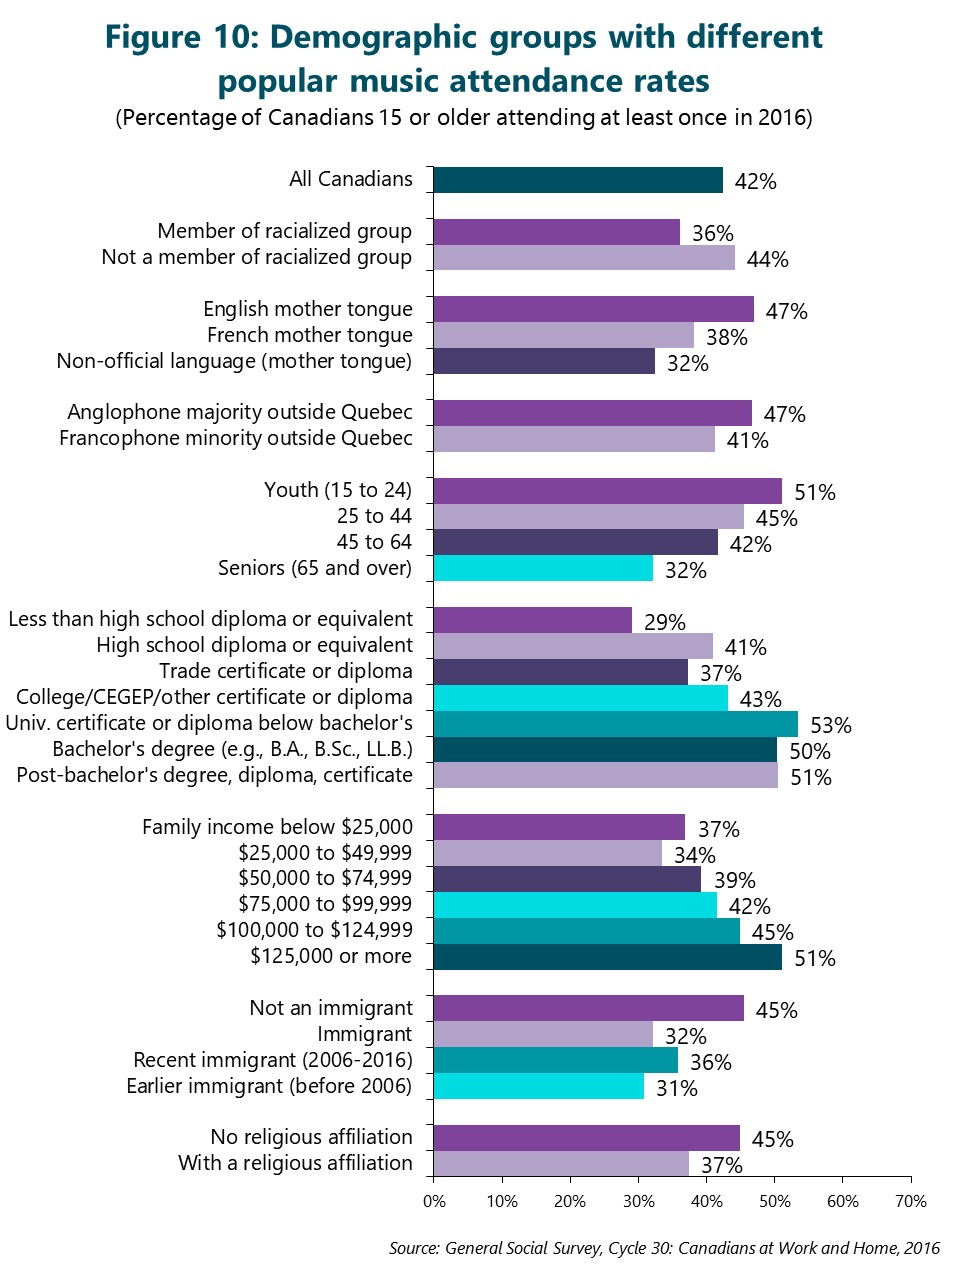
In 2016, 42% of Canadians attended a live popular music performance, excluding festivals.[14]
The popular music attendance rate is very similar to the national average (42%) for relatively few demographic groups, including three demographic groups where there are substantial differences for most other arts activities:
- Women (44%) and men (41%)
- Indigenous and non-Indigenous respondents (42% for each)
- Residents of large urban centres (43%) and residents of rural areas and small population centres (39%)
The popular music attendance rate is also similar between Canadians with or without children in the household (42% and 43%, respectively).
There are numerous demographic differences of at least 5% in the popular music attendance rate, some of which follow the overall patterns for arts attendance. As shown in Figure 10:
- Youth between 15 and 24 are more likely to attend popular music performances than other age ranges.
- Popular music attendance increases significantly with education and income levels.
- Canadians without a religious affiliation are more likely to attend than those with a religious affiliation.
Many differences found in popular music attendance are not common in many other arts activities:
- Racialized Canadians are less likely to attend than non-racialized respondents (36% vs. 44%).
- Immigrant respondents are less likely to attend than non-immigrant respondents (32% vs. 45%). The popular music attendance rate is higher for recent immigrants (36% for those arriving between 2006 and 2016) than for earlier immigrants (31% for those arriving before 2006).
- Anglophones (47%) are much more likely to attend popular music performances than Francophones (38%) and speakers of non-official languages (32%).
- Respondents from the Anglophone majority outside of Quebec (47%) are much more likely to attend than members of the Francophone minority outside of Quebec (41%).
Popular music attendance by women and racialized respondents
As noted above, the popular music attendance rate is 44% for women. An intersectional look at women’s popular music attendance rates shows that:
- Racialized women have lower popular music attendance rates than non-racialized women (36% vs. 46%).
- Immigrant women are much less likely than non-immigrant women to attend popular music performances (31% vs. 48%).
- Women with lower family income levels have lower popular music attendance rates than higher-income women (rate of 37% for women with family incomes below $25,000 and 35% for women with family incomes between $25,000 and $49,999, compared with 45% for women with family incomes between $100,000 and $124,999 and 54% for women with family incomes of $125,000 or more).
Consistent with the overall finding of similarity in the popular music attendance rate between women (41%) and men (37%), popular music attendance is the same for racialized women and men (36%) and similar between non-racialized women and men (46% and 42%).
Immigrant women and men are similarly likely to attend a popular music performance (31% of women and 33% of men). Non-immigrant women (48%) are more likely than non-immigrant men (43%) to attend popular music performances.
The popular music attendance rate is the same for women and men with family incomes below $25,000 (37% for each) and similar between women and men with family incomes between $25,000 and $49,999 (35% vs. 31%).
At higher income levels, the popular music attendance rate is the same for women and men with family incomes between $100,000 and $124,999 (both 45%) but is higher for women (54%) than men (48%) with family incomes of $125,000 or more.
Racialized respondents are less likely (36%) than non-racialized respondents (44%) to attend a popular music performance. An intersectional analysis of the popular music attendance rates of racialized respondents[15] shows that:
- Racialized immigrants have a much lower popular music attendance rate than non-racialized immigrants (29% vs. 38%).
- Racialized non-immigrants have a higher popular music attendance rate than non-racialized non-immigrants (50% vs. 45%).

In 2016, 20% of Canadians attended a “performance of heritage or ethnic dance, theatre or music, for example, Aboriginal Peoples, Chinese or Ukrainian“.[16]
Attendance rates at heritage or ethnic performances do not conform to many of the overall patterns found for other arts activities. For example, women are roughly as likely as men to attend (21% and 19%, respectively).
Family income is not a particularly important factor in attendance at heritage or ethnic performances, with attendance rates of:
- 21% for those with family incomes of $125,000 or more
- 23% for those between $100,000 and $124,999
- 20% for those between $75,000 and $99,999
- 19% for those between $50,000 and $74,999
- 18% for those between $25,000 and $49,999
- 23% for those below $25,000
Canadians without children and those with children at home have similar attendance rates at heritage or ethnic performances (19% and 22%).
Majority-language Anglophones and minority-language Francophones outside of Quebec have very similar attendance rates (21% and 19%).
There is a moderate difference of 4% between residents of rural and smaller population centres and residents of larger centres (17% vs. 21%). The difference is also moderate between Canadians with a religious affiliation and those without (19% vs. 23%).
Some areas where there are demographic differences of 5% or more diverge from broader attendance patterns. As shown in Figure 11:
- Indigenous respondents are much more likely than non-Indigenous respondents to attend heritage or ethnic performances (35% vs. 20%). This finding might not be surprising given that “Aboriginal Peoples” are specifically mentioned in the question.
- Canadians from a racialized group are much more likely than non-racialized respondents to attend (31% vs. 18%).
- Immigrant Canadians are much more likely than non-immigrant respondents to attend (28% vs. 18%).
- The differences between youth attendance rates and older respondents is not as substantial as for many other activities.
- Speakers of non-official languages are most likely to attend heritage or ethnic performances (28% for speakers of non-official languages, compared with 19% of Anglophones and 11% of Francophones).
The strong differences by education level are consistent with the overall patterns found for other arts activities.

Heritage or ethnic performance attendance by women and racialized respondents
As noted above, the attendance rate at heritage or ethnic performances is 21% for women. An intersectional analysis of women’s heritage or ethnic performance attendance rates shows that:
- Racialized women have much higher heritage or ethnic performance attendance rates than non-racialized women (32% vs. 19%).
- Immigrant women are much more likely than non-immigrant women to attend heritage or ethnic performances (29% vs. 19%).
- Women with lower family income levels are about as likely as higher-income women to attend heritage or ethnic performances (rates of 23% for women with family incomes below $25,000 and 18% for women with family incomes between $25,000 and $49,999, compared with 23% for women with family incomes between $100,000 and $124,999 and 22% for women with family incomes of $125,000 or more).
Consistent with the overall finding of similar attendance rates at heritage or ethnic performances between women (21%) and men (19%), heritage or ethnic performance attendance is similar between racialized women and men (32% and 30%) as well as between non-racialized women and men (19% and 16%).
Immigrant women and men are similarly likely to attend a heritage or ethnic performance (29% of women and 27% of men), as are non-immigrant women and men (19% and 17%).
The heritage or ethnic performance attendance rate is the same for women and men with family incomes below $25,000 (23% for each) as well as for women and men with family incomes between $25,000 and $49,999 (18%).
At higher income levels, the heritage or ethnic performance attendance rate is similar between women and men with family incomes between $100,000 and $124,999 (23% and 22%) as well as between women (22%) and men (21%) with family incomes of $125,000 or more.
Racialized respondents are much more likely (31%) than non-racialized respondents (18%) to attend a heritage or ethnic performance. Consistent with this finding, an intersectional analysis of the heritage or ethnic performance attendance rates of racialized respondents[17] shows that:
- Racialized immigrants have a much higher heritage or ethnic performance attendance rate than non-racialized immigrants (32% vs. 23%).
- Racialized non-immigrants have a much higher heritage or ethnic performance attendance rate than non-racialized non-immigrants (30% vs. 17%).

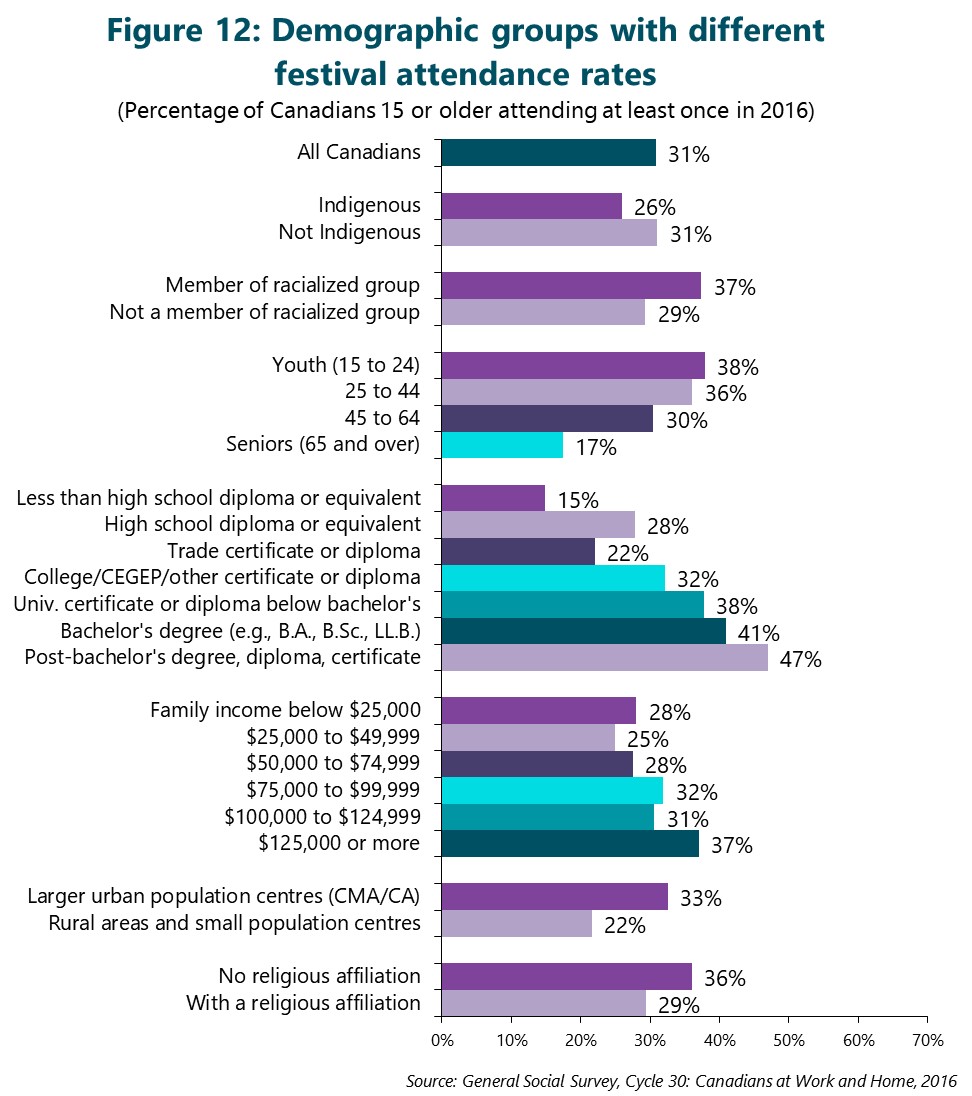
In 2016, 31% of the population 15 or over attended an artistic or cultural festival, such as film, jazz, folk, or comedy.[18]
Some demographic patterns in attendance rates at artistic or cultural festivals diverge from overall arts attendance patterns, such as the equal attendance rates for women and men (31% for each) as well as for Canadians with or without children in the household (also 31% for each).
Festival attendance rates are also similar between:
- Immigrant and non-immigrant Canadians (34% and 30%). However, there is a difference between recent immigrants (40%) and earlier immigrants (33%).
- Canadians with different mother tongues (29% for Anglophones, 29% for Francophones, and 29% for speakers of non-official languages).
- Majority-language Anglophones and minority-language Francophones outside of Quebec (30% and 32%).
Festival attendance rates are higher for non-Indigenous Canadians, members of a racialized group, Canadians with higher education or income levels, those residing in larger urban centres, and those without a religious affiliation:
- Non-Indigenous (31%) vs. Indigenous respondents (26%)
- Racialized (37%) vs. non-racialized Canadians (29%)
- Youth between 15 and 24 years of age (38%) and Canadians between 25 and 44 (36%), compared with those between 45 and 64 (30%) and seniors 65 and over (17%).
- Canadians with higher levels of formal education:
- 47% for those with a university certificate, diploma, degree above the bachelor’s level
- 41% for those with a bachelor’s degree (e.g. B.A., B.Sc., LL.B.)
- 38% for those with a university certificate or diploma below the bachelor’s level
- 32% for those with a college, CEGEP, or other non-university certificate or diploma
- 22% for those with a trade certificate or diploma
- 28% for those with a high school diploma or a high school equivalency certificate
- 15% for those with less than a high school diploma or its equivalent
- Canadians with higher family income levels:
- 37% for those with family incomes of $125,000 or more
- 31% for those between $100,000 and $124,999
- 32% for those between $75,000 and $99,999
- 28% for those between $50,000 and $74,999
- 25% for those between $25,000 and $49,999
- 28% for those below $25,000
- Respondents residing in larger urban centres (33%) vs. those residing in rural areas and small population centres (22%)
- Canadians without a religious affiliation (36%), compared with those with a religious affiliation (29%)
Figure 12 presents those demographic groups with a difference of at least 5% in the festival attendance rate.
Festival attendance by women and racialized respondents
As noted above, the cultural festival attendance rate is 31% for women. An intersectional analysis of women’s attendance rates at artistic or cultural festivals shows that:
- Racialized women have higher festival attendance rates than non-racialized women (39% vs. 29%).
- Immigrant women are more likely than non-immigrant women to attend festivals (35% vs. 29%).
- Women with lower family income levels are less likely than higher-income women to attend festivals (rates of 25% for women with family incomes below $25,000 and 24% for women with family incomes between $25,000 and $49,999, compared with 31% for women with family incomes between $100,000 and $124,999 and 39% for women with family incomes of $125,000 or more).
Consistent with the finding that women and men are equally likely to attend festivals (31% for each), festival attendance is similar between racialized women and men (39% and 36%) as well as between non-racialized women and men (29% and 30%).
Immigrant women and men are similarly likely to attend a festival (35% of women and 33% of men), as are non-immigrant women (29%) and men (31%).
The festival attendance rate is much lower for women than men with family incomes below $25,000 (25% for women vs. 32% for men) but is similar for women and men with family incomes between $25,000 and $49,999 (24% and 26%).
At higher income levels, the festival attendance rate is the same for women and men with family incomes between $100,000 and $124,999 (31%) and similar between women (39%) and men (36%) with family incomes of $125,000 or more.
Racialized respondents are more likely (37%) than non-racialized respondents (29%) to attend a festival. An intersectional analysis of the festival attendance rates of racialized respondents[19] shows that:
- Racialized and non-racialized immigrants have a similar attendance rate at artistic or cultural festivals (34% vs. 36%).
- Racialized non-immigrants have a much higher festival attendance rate than non-racialized non-immigrants (44% vs. 29%).

In 2016, for the first time, the General Social Survey included questions related to respondents’ active participation in eight arts activities.
One-half of Canadians 15 or older (50%) made or performed art in some way in 2016.[20] This statistic includes eight participatory activities (which are not examined separately in this report):
- Crafts (18% of Canadians 15 or older)
- Music (15%)
- Visual arts (13%)
- Writing (11%)
- Dancing (9%)
- Audio-visual and interactive media (4%)
- Theatre (1.4%)
- Another creative arts activity (5%).
While quite thorough, these categories may not capture potential cultural differences regarding making and performing art. For example, the response options seem to reference “adult” arts activities, which means that parents may not have included artistic activities undertaken with their children. In addition, some Indigenous People (and other groups) have a holistic worldview that incorporates artistic activities into everyday life. The questions may not be perfect fit for these groups.
Unlike the overall arts attendance pattern, participation in making or performing art is very similar to the national average (50%) for demographic groups such as:
- Canadians of different family income levels (where there is only a gap at the lower range of incomes):
- 53% for those with family incomes below $25,000
- 47% for those between $25,000 and $49,999
- 49% for those between $50,000 and $74,999
- 52% for those between $75,000 and $99,999
- 50% for those between $100,000 and $124,999
- 52% for those at $125,000 or above
- Residents of larger urban centres (50%) and residents of rural areas and small population centres (also 50%)
Other demographic groups with only minor differences in the participation rates in making or performing art include:
- Indigenous respondents (48%), compared with non-Indigenous respondents (52%)
- Respondents from racialized groups (50%) and those not from racialized groups (51%)
- Non-immigrant respondents (51%) and immigrant respondents (47%), with the same participation rate for recent immigrants (47% for those arriving between 2006 and 2016) and earlier immigrants (47% for those arriving before 2006).
- Francophones outside of Quebec (58%) and the Anglophone majority outside of Quebec (56%)
Figure 13 highlights these similarities.

Participation rates in making or performing art are higher for women than men, for Canadians with higher levels of formal education, for those with English as their maternal language, for those without children at home, and for those without a religious affiliation:
- Women (55%) compared with men (46%)
- Anglophones (56%) compared with Francophones (40%) and speakers of non-official languages (44%)
- Youth between 15 and 24 years of age (64%) compared with other age groups (50% for those between 25 and 44, 47% for those between 45 and 64, and 47% for seniors 65 and over)
- Canadians with higher levels of formal education:
- 60% for those with a university certificate, diploma, degree above the bachelor’s level
- 53% for those with a bachelor’s degree (e.g. B.A., B.Sc., LL.B.)
- 57% for those with a university certificate or diploma below the bachelor’s level
- 52% for those with a college, CEGEP, or other non-university certificate or diploma
- 43% for those with a trade certificate or diploma
- 49% for those with a high school diploma or a high school equivalency certificate
- 45% for those with less than a high school diploma or its equivalent
- Canadians without children at home (53%), compared with those with children at home (46%)
- Canadians without a religious affiliation (55%), compared with those with a religious affiliation (49%)
Figure 14 depicts these differences.

Making or performing art by women and racialized respondents
As noted above, the participation rate in making or performing art is 55% for women. An intersectional look at women’s participation rates in making or performing art shows that:
- Racialized women are about as likely as non-racialized women to make or perform art (52% and 56%).
- Immigrant women are less likely than non-immigrant women to make or perform art (49% vs. 57%).
- Women with lower family income levels are about as likely as higher-income women to make or perform art (56% of women with family incomes below $25,000 and 53% of women with family incomes between $25,000 and $49,999, compared with 55% of women with family incomes between $100,000 and $124,999 and 56% of women with family incomes of $125,000 or more).
Consistent with the overall finding that women are much more likely than men to make or perform art (55% vs. 46%), women in all demographic groups are more likely than men in the same groups to have made or performed art in 2016.
Racialized respondents are as likely (50%) as non-racialized respondents (51%) to make or perform art. An intersectional analysis of racialized respondents’ participation rates[21] in making or performing art shows that:
- Racialized immigrants are less likely than non-racialized immigrants to make or perform art (45% vs. 51%).
- Racialized non-immigrants are more likely than non-racialized non-immigrants to make or perform art (58% vs. 51%).


Demographic questions in the 2016 General Social Survey that are highlighted in this report include:[22]
- A binary question about sex[23], with 5,452 female and 4,375 male respondents to the arts attendance questions in the General Social Survey (GSS).
- A question to identify Indigenous respondents (referred to in the survey as Aboriginal), including 384 Indigenous and 9,402 non-Indigenous respondents.
- Questions to identify racialized Canadians (referred to in the survey as “visible minority”), including 1,225 racialized and 8,454 non-racialized respondents. The GSS identified visible minority respondents as people who are not Indigenous and reported that they are not white based on the following question: “You may belong to one or more racial or cultural groups on the following list. Are you…?” [Common racial or cultural groups were listed, and multiples were allowed.]
- A question related to mother tongues, including 5,980 Anglophones, 1,476 Francophones, and 1,289 respondents with a non-official mother tongue. The GSS notes that “mother tongue refers to the first language learned at home in childhood and still understood by the person at the time the data was collected. If the person no longer understands the first language learned, the mother tongue is the second language learned. For a person who learned two languages at the same time in early childhood, the mother tongue is the language this person spoke most often at home before starting school. The person has two mother tongues only if the two languages were used equally often and are still understood by the person.” The above counts exclude those who mentioned more than one mother tongue.
- Hill Strategies’ combination of responses to the mother tongue and province-of-residence questions, which identified minority-language Francophones (344 respondents outside Quebec) and majority-language Anglophones (6,644 respondents outside Quebec). Because of the low number of Anglophone survey respondents in Quebec (n=94), comparisons with the Francophone majority in Quebec (n=1,309) are not provided in this report.
- Rural (n=1,805) and urban (n=7,703) respondents, identified based on respondents’ postal codes, which were associated with larger urban centres (Census Metropolitan Areas – CMAs and Census Agglomerations – CAs) or rural and smaller population areas (outside of CMAs and CAs). Statistics Canada does not include residents of Prince Edward Island as either urban or rural.
- Age groups condensed into four categories for this report: youth 15 to 24 years of age (n=765), respondents between 25 and 44 (n=2,694), respondents between 45 and 64 (n=3,601), and seniors 65 and over (n=2,766).
- A question to identify immigrants to Canada (“Are you now, or have you ever been a landed immigrant in Canada?”), including 1,699 immigrant and 8,127 non-immigrant respondents. Immigrant respondents were sub-divided into recent immigrants (n=415 who immigrated during the 10 years prior to the 2016 GSS) and earlier immigrants (n=1,236 who immigrated more than 10 years prior to the 2016 GSS).
- A question about respondents’ education levels (“What is the highest certificate, diploma or degree that you have completed?”), which identified the following levels: less than high school diploma or its equivalent (n=1,404); high school diploma or a high school equivalency certificate (n=2,402); trade certificate or diploma (n=818); college/CEGEP/other non-university certificate or diploma (n=2,045); university certificate or diploma below the bachelor’s level (n=415); Bachelor’s degree (e.g. B.A., B.Sc., LL.B.) (n=1,750); and university certificate, diploma, degree above the BA level (n=904)
- A question about family income, which was grouped into the following levels: less than $25,000 (n=1,269); $25,000 to $49,999 (n=1,850); $50,000 to $74,999 (n=1,871); $75,000 to $99,999 (n=1,461); $100,000 to $124,999 (n=1,051); and $125,000 or more (n=2,325).
- A question about the number of children residing with the respondents, grouped into 2,761 respondents with at least one child at home and 7,065 respondents without children at home.
- A question about respondents’ religious affiliation (if any), grouped into 7,697 respondents with a religious affiliation and 1,955 respondents without a religious affiliation.
Footnotes
[1] Because of the survey sample design, no territorial data are available.
[2] The analysis of the 2016 data in this report is based on Statistics Canada’s General Social Survey (GSS) Canadians at Home and at Work – Cycle 30 Public Use Microdata File, 2016. All computations, use, and interpretation of these data are entirely that of Hill Strategies Research.
[3]Christoffersen, A., (2016). ““Intersectional approaches to equality research and data: Research and data briefing” Equality Challenge Unit. Retrieved from: http://www.ecu.ac.uk/wp-content/uploads/2017/04/Research_and_data_briefing_2_Intersectional_approaches_to_equality_research_and_data.pdf
[4] Statistics Canada (2016). General Social Survey – Canadians at Work and Home: Questionnaire. Retrieved from http://www23.statcan.gc.ca/imdb/p3Instr.pl?Function=assembleInstr&lang=en&Item_Id=302913
[5] This proportion only decreases slightly (to 68%) when art galleries are also excluded. As such, an analysis of arts performances and festivals (i.e., arts attendance minus art gallery attendance) would be very similar to the statistics reported in this section.
[6] An intersectional analysis for racialized respondents by income and education is not possible, given the small number of survey respondents in each income and education category (less than 250 respondents in each).
[7] This question was phrased as follows: During the past 12 months, how often did you go to a public art gallery or art museum (including attendance at special art exhibits)? Source: Statistics Canada (2016). General Social Survey – Canadians at Work and Home: Questionnaire. Retrieved from http://www23.statcan.gc.ca/imdb/p3Instr.pl?Function=assembleInstr&lang=en&Item_Id=302913
[8] An intersectional analysis for racialized respondents by income and education is not possible, given the small number of survey respondents in each income and education category (less than 250 respondents in each).
[9] The question was phrased as follows: During the past 12 months, how often did you attend a live performance, such as a drama, musical theatre, dinner theatre or comedy, excluding at festivals? Include: drama, comedy, avant-garde theatre, dinner theatre and musical (includes rock operas such as Tommy, Broadway-style shows such as The Book of Mormon and West Side Story, and music/theatre spectacles such as Phantom of the Opera, Mama Mia and Cats). Source: Statistics Canada (2016). General Social Survey – Canadians at Work and Home: Questionnaire. Retrieved from http://www23.statcan.gc.ca/imdb/p3Instr.pl?Function=assembleInstr&lang=en&Item_Id=302913
[10] An intersectional analysis for racialized respondents by income and education is not possible, given the small number of survey respondents in each income and education category (less than 250 respondents in each).
[11] The question was: During the past 12 months, how often did you attend a performance of symphonic or classical music, excluding at festivals? Source: Statistics Canada (2016). General Social Survey – Canadians at Work and Home: Questionnaire. Retrieved from http://www23.statcan.gc.ca/imdb/p3Instr.pl?Function=assembleInstr&lang=en&Item_Id=302913
[12] Given the relatively low overall rate of classical music attendance (16%), this section does not adhere as closely to the general rule of 5% differences in attendance rates.
[13] An intersectional analysis for racialized respondents by income and education is not possible, given the small number of survey respondents in each income and education category (less than 250 respondents in each).
[14] The question was phrased as: During the past 12 months, how often did you attend a performance of popular music, excluding at festival? Source: Statistics Canada (2016). General Social Survey – Canadians at Work and Home: Questionnaire. Retrieved from http://www23.statcan.gc.ca/imdb/p3Instr.pl?Function=assembleInstr&lang=en&Item_Id=302913
[15] An intersectional analysis for racialized respondents by income and education is not possible, given the small number of survey respondents in each income and education category (less than 250 respondents in each).
[16] The full question was: During the past 12 months, how often did you: a) attend a performance of heritage or ethnic dance, theatre or music, for example, Aboriginal Peoples, Chinese or Ukrainian? Source: Statistics Canada (2016). General Social Survey – Canadians at Work and Home: Questionnaire. Retrieved from http://www23.statcan.gc.ca/imdb/p3Instr.pl?Function=assembleInstr&lang=en&Item_Id=302913
[17] An intersectional analysis for racialized respondents by income and education is not possible, given the small number of survey respondents in each income and education category (less than 250 respondents in each).
[18] The question was phrased as follows: During the past 12 months, how often did you attend a cultural or artistic festival, such as film, jazz, folk or comedy? Source: Statistics Canada (2016). General Social Survey – Canadians at Work and Home: Questionnaire. Retrieved from http://www23.statcan.gc.ca/imdb/p3Instr.pl?Function=assembleInstr&lang=en&Item_Id=302913
[19] An intersectional analysis for racialized respondents by income and education is not possible, given the small number of survey respondents in each income and education category (less than 250 respondents in each).
[20] The phrasing of these questions was: “Now, some questions about cultural activities or hobbies you are involved in. In the past 12 months, which of the following have you actively participated in? a) Making music (e.g., singing, playing an instrument or remixing music); b) Theatre (e.g., acting, storytelling or comedy); c) Audio-Visual and Interactive Media (e.g., making films, animation or videos); d) Dance (e.g., socially, in a performance or choreography); e) Visual arts ( e.g., painting, photography, sculpture or drawing); f) Craft (e.g., needlework, scrapbooking, woodwork, metalwork or pottery); g) Writing (e.g., poetry, plays, stories, editorials and reviews); h) Other – Specify”. Source: Statistics Canada (2016). General Social Survey – Canadians at Work and Home: Questionnaire. Retrieved from http://www23.statcan.gc.ca/imdb/p3Instr.pl?Function=assembleInstr&lang=en&Item_Id=302913
[21] An intersectional analysis for racialized respondents by income and education is not possible, given the small number of survey respondents in each income and education category (less than 250 respondents in each).
[22] The question details are from Statistics Canada’s GSS 2016 – Data Dictionary, General Social Survey (Canadians at Work and Home) 2016, published May 2018.
[23] The survey did not ask about non-binary or other gender identities.
