


A Statistical Profile of Artists in Canada in 2016 (With Summary Information about Cultural Workers)

The report focuses on the working lives of artists in Canada, including statistics on:
- The overall number of artists
- Artists by occupation
- Demographic information such as gender, education, age, Indigenous people, members of racialized groups[1], and more
- Self-employment rates
- Total incomes, employment incomes, and household incomes
- The industries where artists work, with a focus on the three most common sectors for artists: 1) arts, entertainment, and recreation; 2) educational services; and 3) information and cultural industries
The report also provides a brief summary of the situation of cultural workers in Canada (a broader grouping which includes but extends well beyond artists).
The report is based on a custom data request from the 2016 long-form census, which classifies people in the occupation in which they worked the most hours during the census reference week (May 1 to 7, 2016).
Over 158,000 artists in Canada
There are 158,100 artists (who spent more time at their art than at any other occupation in May of 2016), representing almost 1% of the overall Canadian labour force (0.87%). In other words, 1 in every 116 Canadian workers is an artist.
The number of artists (158,100) is greater than the labour force in automotive manufacturing (146,200) and the utilities sector (136,400), as shown in Figure ES1.

9 occupations included as “artists”
Nine detailed occupation codes are included in the count of artists. The occupations are shown from largest to smallest in Figure ES2.[2]

Key demographic and employment characteristics
The report contains other key findings related to the working lives of artists:
- Women comprise 52% of artists, higher than the proportion of all workers (48%).
- A much larger percentage of artists than all workers have a bachelor’s degree or higher (47% vs. 28%).
- 52% of artists are self-employed, compared with only 12% of all Canadian workers.
- The age distribution of artists is fairly similar to all workers: nearly one-half of artists (46%) are 45 years of age or older, similar to the 44% of all workers. However, more artists than all workers are 65 years of age or older (9% vs. 4%).
- Racialized Canadians are under-represented among artists (15%) compared with all workers (21%).
- Indigenous and immigrant workers are slightly under-represented among artists: Indigenous People (3.1% of artists and 3.9% of all workers) and immigrants (21% of artists and 24% of all workers).
Median income of artists is 44% lower than all Canadian workers
As shown in Figure ES3, the median individual income of Canada’s artists is $24,300, or 44% less than all Canadian workers ($43,500). Cultural workers have median individual incomes of $41,000, or 6% less than all workers.

This summary focuses on median incomes, which are believed to provide a better indication of the typical situation of artists than the average (i.e., the “mean”), which is more strongly affected by a few individuals with very high incomes.
The main component of total income, for most workers, is employment income (including wages, salaries, and self-employment earnings). A typical artist has employment income of $17,300, a figure that is 56% lower than the median of all workers ($39,000).
For the first time in 2016, household income statistics were requested from the census. The findings from this analysis are somewhat less dire than the individual income statistics. A typical artist has a household income of $57,800, 33% lower than all workers ($86,500).
Median incomes vary substantially by occupation and industry
There is a vast difference in median incomes between the nine arts occupations. From lowest to highest, the median incomes by occupation are:
- Dancers: $15,800 (64% lower than the median income of all workers)
- Other performers not classified elsewhere: $16,900 (61% lower)
- Musicians and singers: $17,900 (59% lower)
- Actors and comedians: $18,500 (57% lower)
- Visual artists: $20,000 (54% lower)
- Artisans and craftspeople: $20,500 (53% lower)
- Conductors, composer, and arrangers: $29,700 (32% lower)
- Authors and writers: $40,000 (8% lower)
- Producers, directors, choreographers, and related occupations: $49,300 (13% higher than the median income of all workers)
The median income of artists is much higher in the information and cultural industries grouping ($44,700) than in the other industry sectors: $19,300 in arts, entertainment, and recreation, $17,500 in educational services, and $30,100 in all other industries.
Over 726,000 cultural workers
There are 726,600 cultural workers in Canada, including heritage occupations (such as librarians, museum workers, and archivists), cultural occupations (such as designers, editors, and architects), and the nine arts occupations. Cultural workers account for 4% of the overall labour force. In other words, one in every 25 Canadian workers has a cultural occupation.
The number of cultural workers (726,600) is over two-and-a-half times larger than the labour force in real estate (280,100), about double the labour force on farms (342,800), and slightly higher than the labour force in the wholesale trade industry (665,700).
About this report
This report contains statistics on the working lives of artists and cultural workers analyzed from the 2016 long-form census. The first section of the full report looks at artists as a group, with summary statistics about cultural workers, while the second section provides information about each of the nine arts occupations.
Readers should keep in mind a number of important aspects of census data. When the census was conducted in 2016, Canadians 15 and older were classified in the occupation in which they worked the most hours during the census reference week (May 1 to 7, 2016). If they were unemployed during that week, they are classified based on the job at which they worked the longest since January 1, 2015. If they did not work at all during that period, or if they were not in the labour force during the reference week, they are excluded from the experienced labour force (and the statistics in this report). The census collected income information for 2015, the most recent full calendar year.
It is also important to note that, due to major changes in methods between the 2011 National Household Survey and the 2016 census, data in this report are not comparable to previous reports.
Some aspects of the census have particular relevance in capturing the working lives of artists:
- Artists who spent more time at another occupation than at their artwork during the reference week would be classified in the other occupation. The census does not capture information about secondary occupations.
- Each occupation includes individuals who are employed or self-employed.
- Artists who teach in post-secondary, secondary, or elementary schools are classified as professors or teachers, not in artistic occupations. Instructors and teachers in some settings (such as private arts schools, academies, and conservatories) are included as “artists”.
Full methodological notes can be found in Appendix 2 of the full report.
Subsequent reports will examine artists in Canadian municipalities and demographic differences in the situations of artists.


Using custom data that Hill Strategies requested from Statistics Canada’s 2016 long-form census, this report examines the number of artists, selected demographic characteristics of artists, artists’ incomes, and the sectors in which artists work. The report also provides summary information about cultural workers and the overall labour force.
This section highlights artists as a group, with summary statistics about cultural workers, while the subsequent section provides information about each of the nine arts occupations.
Over 158,000 artists in Canada
There are 158,100 artists in Canada who spent more time at their art than at any other occupation in May of 2016 (the collection period for census data). The number of artists represents 0.87% of the overall labour force (18 million Canadians). One in every 116 Canadian workers is an artist.[3]
The number of artists (158,100) is greater than the labour force in automotive manufacturing (146,200) and the utilities sector (136,400), as shown in Figure 1.

Nine detailed occupation codes are included in the count of artists. The occupations are shown from largest to smallest in Figure 2.[4]

Over 726,000 cultural workers
There are 726,600 cultural workers in Canada, including people working in heritage occupations (such as librarians, curators, and archivists), cultural occupations (such as graphic designers, print operators, editors, translators, and architects), and the nine arts occupations. Cultural workers account for 4% of the overall labour force. In other words, one in every 25 Canadian workers has a cultural occupation.
As shown in Figure 3, the number of cultural workers (726,600) is over two-and-a-half times larger than the labour force in real estate (280,100), about double the labour force on farms (342,800), and slightly higher than the labour force in the wholesale trade industry (665,700).
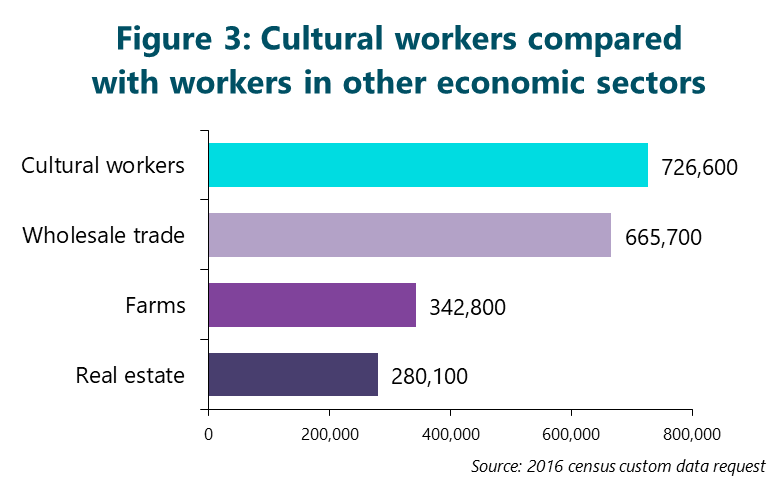
Table 1 summarizes key statistics on the number of artists and cultural workers.
| Table 1: Number of artists and cultural workers, Canada, 2016 | ||
| Occupation | Number | % of all workers |
| Artists | 158,100 | 0.87% |
| Musicians and singers | 35,000 | 0.19% |
| Authors and writers | 27,700 | 0.15% |
| Producers, directors, choreographers, and related occupations | 27,600 | 0.15% |
| Visual artists | 21,100 | 0.12% |
| Artisans and craftspeople | 14,700 | 0.08% |
| Actors and comedians | 11,400 | 0.06% |
| Dancers | 10,100 | 0.06% |
| Other performers | 6,400 | 0.03% |
| Conductors, composers, and arrangers | 4,200 | 0.02% |
| Cultural workers | 726,600 | 3.98% |
| All workers | 18.3 million | 100% |
| Source: 2016 census custom data request. | ||
Key demographic and employment characteristics of artists
A defining feature of artists is their high level of education: a much larger percentage of artists than all workers have a bachelor’s degree or higher (47% vs. 28%). There are fewer artists than all workers without a high school diploma (6% vs. 10%), with only a high school diploma (21% vs. 26%), and with an apprenticeship or trades certificate (4% vs 11%). The proportion with a college or CEGEP diploma or certificate is similar between artists and all workers (21% vs. 22%).
While less than one-half of the overall labour force in Canada is female (48%), women comprise 52% of artists.
Nearly one-half of artists (46%) are 45 years of age or older, a percentage that is similar to all workers (44%). However, more artists than all workers are 65 years of age or older (9% vs. 4%).
There are relatively similar proportions of artists and all workers in other age ranges:
- 15 to 24: 11% of artists and 14% of all workers
- 25 to 34: 22% of artists and 21% of all workers
- 35 to 44: 21% of artists and all workers
- 45 to 54: 20% of artists and 23% of all workers
- 55 to 64: 17% of artists and all workers
Racialized Canadians are under-represented among artists (15%) compared with all workers (21%).
Indigenous and immigrant workers are slightly under-represented among artists: Indigenous (3.1% of artists and 3.9% of all workers) and immigrants (21% of artists and 24% of all workers).
Three-quarters of all artists (76%) speak English most often at home, somewhat higher than the equivalent percentage among all workers (70%). A lower percentage of artists than all workers speak French (18% vs. 21%) or a non-official language (9% vs. 14%). (Note: The language statistics add up to more than 100%, because those who speak two or more languages equally at home are included in multiple language categories.)
Based on the language spoken most often at home, the 9,300 artists who are members of official language minority communities represent 5.9% of all artists in Canada (slightly higher than the proportion of all workers: 4.7%). In Quebec, the 7,300 English-language artists represent 4.6% of all Canadian artists, while English-minority workers in Quebec represent just 2.8% of all Canadian workers. Outside of Quebec, the 2,000 French-language artists represent 1.2% of all Canadian artists, while French-minority workers outside of Quebec represent 1.8% of all Canadian workers.
High self-employment among artists
Self-employment is a reality of the working lives of many artists. The 2016 census data indicate that 52% of artists are self-employed, compared with only 12% of all Canadian workers.
Artists work in many different sectors of the economy (as shown in Figure 4), but the largest industry segment is “arts, entertainment, and recreation”, which employs about one-third of all artists (34%), compared with just 2% of all workers. The next-largest sectors are educational services (20% of artists and 7% of all workers) and information and cultural industries (19% of artists and 2% of all workers). The information and cultural industries grouping includes publishing, motion pictures, sound recording, broadcasting, and other industries. All other industries (i.e., excluding the three noted above) employ 26% of artists (and 88% of all workers).
Within the arts, entertainment, and recreation industry grouping, the largest number of artists work in the “independent artists, writers, and performers” group (21% of all artists), followed by performing arts companies (11%).

The median income of artists is much higher in the information and cultural industries grouping ($44,700) than in the other industry sectors: $19,300 in arts, entertainment, and recreation, $17,500 in educational services, and $30,100 in all other industries.
Within arts, entertainment, and recreation, the median income is very low in both of the main sub-sectors: $19,100 for independent artists, writers, and performers; and $20,200 in performing arts companies.
Low median incomes
Many of Canada’s 158,100 artists have low earnings when compared with other Canadian workers. A typical artist[5] has:
- Total individual income of $24,300, 44% lower than all workers ($43,500)
- Employment income of $17,300, 56% lower than all workers ($39,000)
- Household income of $57,800, 33% lower than all workers ($86,500)
A comparison of the typical (i.e., median) individual incomes of artists, cultural workers, and all workers is provided in Figure 5.

For artists, average incomes tend to be higher than median incomes, due to the impact of a relatively small number of artists who have high incomes. Key statistics regarding the average incomes of artists follow:
- Total individual income: average of $38,500 (32% lower than the average of all workers: $56,900)
- Employment income: average of $30,700 (40% lower than all workers: $51,100)
- Employment income represents 80% of artists’ individual incomes and 90% of all workers’ incomes.
- Household income: average of $78,400 (28% lower than all workers: $108,900)
- Artists’ individual incomes represent 49% of their households’ incomes, lower than the equivalent percentage among all workers (52%).
Cultural workers: demographics
Like artists, cultural workers tend to have very high levels of education: a much larger percentage of cultural workers than all workers have a bachelor’s degree or higher (43% vs. 28%). Similarly, the proportion of cultural workers with a college or CEGEP diploma or certificate is higher than for all workers (27% vs. 22%). There are fewer cultural workers than all workers without a high school diploma (6% vs. 10%), with only a high school diploma (21% vs. 26%), and with an apprenticeship or trades certificate (4% vs 11%).
Women comprise 51% of cultural workers but only 48% of the overall labour force in Canada.
There are similar proportions of cultural workers and all workers in all age ranges, with the exception of the two youngest age ranges:
- 15 to 24: 10% of cultural workers and 14% of all workers
- 25 to 34: 27% of cultural workers and 21% of all workers
- 35 to 44: 23% of cultural workers and 21% of all workers
- 45 to 54: 20% of cultural workers and 23% of all workers
- 55 to 64: 15% of cultural workers and 17% of all workers
- 65 and older: 5% of cultural workers and 4% of all workers
Racialized Canadians are somewhat under-represented among cultural workers (18%) compared with all workers (21%). Immigrant workers are also slightly under-represented (21% of cultural workers and 24% of all workers).
Indigenous people are somewhat under-represented among cultural workers (2.7% of cultural workers and 3.9% of all workers).
The languages spoken most often at home are quite similar between cultural workers and all workers: English (72% vs. 70%); French (21% for both); and non-official languages (10% vs. 14%).
Based on the language spoken most often at home, the 39,300 cultural workers who are members of official language minority communities represent 5.4% of all cultural workers in Canada (slightly higher than the proportion of all workers: 4.7%). In Quebec, the 28,800 English-language cultural workers represent 4.0% of all Canadian cultural workers, while English-minority workers in Quebec represent just 2.8% of all Canadian workers. Outside of Quebec, the 10,500 French-language cultural workers represent 1.4% of all Canadian cultural workers, while French-minority workers outside of Quebec represent 1.8% of all Canadian workers.
Incomes of cultural workers
A typical cultural worker[6] has:
- Total individual income of $41,000, 6% lower than all workers ($43,500)
- Employment income of $37,200, 5% lower than all workers ($39,000)
- Household income of $75,400, 13% lower than all workers ($86,500)
Key statistics regarding the average incomes of cultural workers follow:
- Total individual income: average of $48,800 (14% lower than the average of all workers: $56,900)
- Employment income: average of $44,000 (14% lower than all workers: $51,100)
- Employment income represents 90% of the individual incomes of both cultural workers and all workers.
- Household income: average of $92,000 (16% lower than all workers: $108,900)
- Cultural workers’ individual incomes represent 53% of their households’ incomes, similar to the percentage among all workers (52%).
Employment characteristics of cultural workers
Cultural workers are self-employed at roughly double the rate of all Canadian workers (26% vs. 12%). Nearly one-half of self-employed cultural workers are artists.
For cultural workers, the largest industry segment is information and cultural industries (employing 20% of cultural workers and 2% of all workers).
Compared with artists, cultural workers are much less concentrated in the arts, entertainment, and recreation industry sector, which accounts for 12% of cultural workers, compared with 34% of artists and 2% of all workers.
An equal proportion of cultural workers and all workers are employed in the educational services sector (7% of both). All other industries (i.e., excluding the three noted above) employ 60% of cultural workers (and 88% of all workers).
The median income of cultural workers is much higher in the information and cultural industries grouping ($47,100) than in the other industry sectors: $26,100 in educational services and $24,100 in arts, entertainment, and recreation. The median income of cultural workers in all other industries is $43,300.

The spotlight sections that follow contain key facts about the demographics, employment characteristics, and incomes for each of the nine arts occupations. The nine occupations are presented from the largest occupation (musicians and singers) to the smallest (conductors, composers, and arrangers).
Key facts about musicians and singers
The 35,000 musicians and singers in Canada represent 22% of all artists. Among this large group of artists:
- 52% are female, equal to the proportion of all artists but higher than the proportion of all workers (48%).
- 52% have a bachelor’s degree or higher, somewhat higher than the proportion of all artists (47%) and much higher than that of all workers (28%).
- 46% are 45 years of age or older, equal to the proportion of all artists and similar to that of all workers (44%).
- 17% are members of racialized groups, slightly higher than the proportion of all artists (15%) but lower than that of all workers (21%).
- Only 1.9% are Indigenous, compared with 3.1% of all artists and 3.9% of all workers.
- 21% are immigrants to Canada, equal to the proportion of all artists and slightly lower than that of all workers (24%).
- Only 15% speak French most often at home, compared with 18% of all artists and 21% of all workers.
- 60% are self-employed, a very high proportion compared with all artists (52%) and all workers (12%).

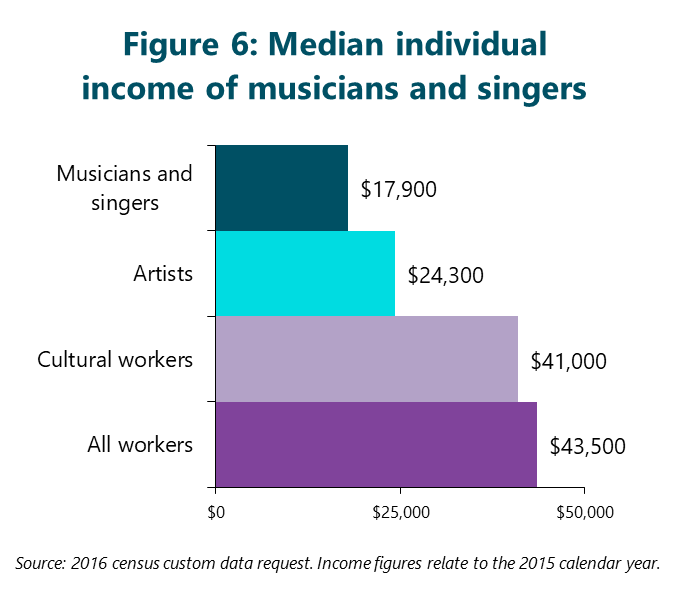
Figure 6 compares the median incomes of musicians and singers, all artists, cultural workers, and all workers. A typical musician or singer in Canada has:
- Total individual income of $17,900, lower than the median of all artists ($24,300) and well below that of all workers ($43,500).
- Employment income of $12,300, lower than the median of all artists ($17,300) and much lower than that of all workers ($39,000).
- Household income of $44,600, below the median of all artists ($57,800) and just over one-half of the median of all workers ($86,500).
Key statistics about the average incomes of musicians and singers follow:
- Total individual income: average of $27,500, lower than that of all artists ($38,500) and much lower than that of all workers ($56,900).
- Employment income: average of $19,600, much lower than those of all artists ($30,700) and all workers ($51,100).
- Employment income represents 71% of musicians’ individual incomes, compared with 80% of all artists’ individual incomes and 90% of all workers’ incomes.
- Household income: average of $63,000, below the average of all artists ($78,400) and all workers ($108,900).
- The individual incomes of musicians and singers represent 44% of their households’ incomes, lower than the equivalent percentages among all artists (49%) and all workers (52%).
Many musicians and singers teach for a living
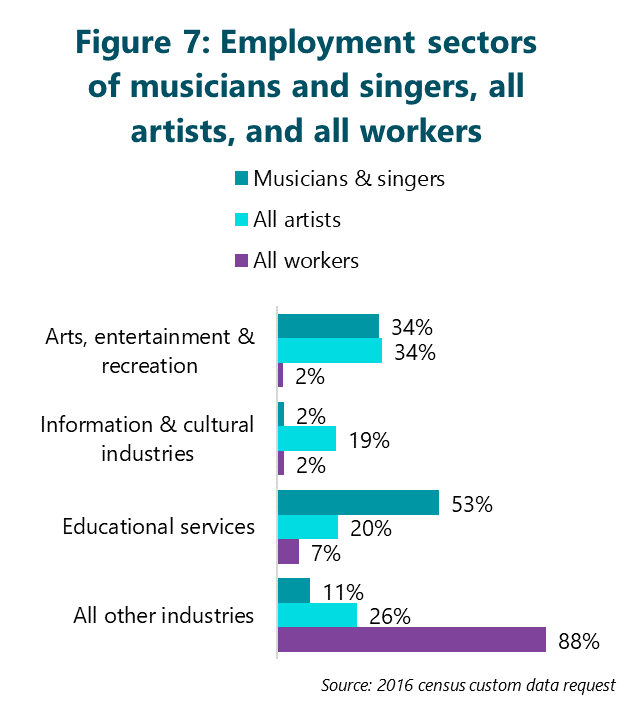
Among musicians and singers, 53% work in educational services, the second-highest proportion among the nine arts occupations and much higher than the averages of all artists (20%) and all workers (7%). The median income of musicians and singers is just $17,400 in the education sector.[7]
One-third (34%) work in arts, entertainment, and recreation, almost all of whom work in performing arts organizations (29%). The median income of musicians and singers is just $17,900 in both the broader industry group and the more detailed performing arts sub-group.
Only 2% of musicians and singers work in information and cultural industries, equal to the proportion of all workers but much lower than that of all artists (19%). Figure 7 shows the full distribution of musicians and singers by sector.

Key facts about authors and writers
Authors and writers are the second-largest arts occupation in Canada: the 27,700 writers account for 18% of all artists. Key demographic and employment information about writers follows:
- 55% are female, higher than the proportions of all artists (52%) and all workers (48%).
- 69% have a bachelor’s degree or higher, the highest proportion of the nine arts occupations and much higher than the proportions of all artists (47%) and all workers (28%).
- 52% are 45 years of age or older, higher than the proportions of all artists (46%) and all workers (44%).
- 13% are members of racialized groups, slightly lower than the proportion of all artists (15%) and much lower than that of all workers (21%).
- Only 2.3% are Indigenous, compared with 3.1% of all artists and 3.9% of all workers.
- 21% are immigrants to Canada, equal to the proportion of all artists and slightly lower than that of all workers (24%).
- Only 14% speak French most often at home, compared with 18% of all artists and 21% of all workers.
- 51% are self-employed, similar to the proportion of all artists (52%) and much higher than that of all workers (12%).

Figure 8 compares the median incomes of writers, all artists, cultural workers, and all workers. A typical writer in Canada has:
- Total individual income of $40,000, much higher than the median of all artists ($24,300) but below that of all workers ($43,500).
- Employment income of $31,800, much higher than the median of all artists ($17,300) but lower than that of all workers ($39,000).
- Household income of $73,400, higher than the median of all artists ($57,800) but lower than that of all workers ($86,500).

Key statistics about the average incomes of writers follow:
- Total individual income: average of $50,300, much higher than that of all artists ($38,500) but lower than that of all workers ($56,900).
- Employment income: average of $40,500, much higher than that of all artists ($30,700) but lower than that of all workers ($51,100).
- Employment income represents 81% of writers’ individual incomes, compared with 80% of all artists’ individual incomes and 90% of all workers’ incomes.
- Household income: average of $93,900, above the average of all artists ($78,400) but below that of all workers ($108,900).
- The individual incomes of writers represent 54% of their households’ incomes, higher than the equivalent percentages among all artists (49%) and all workers (52%).
Many authors and writers work outside of culture and education
In the occupation classification, the “authors and writers” category excludes journalists but is otherwise quite broad, stretching well beyond novelists, poets, and other “artistic” writers. The description of authors and writers indicates that they might be employed in corporations, governments, advertising, new media companies, or other businesses.
A reflection of this broad definition, 44% of writers work in industries other than the three cultural and educational sectors highlighted in this report (compared with just 26% of all artists). The median income of writers working outside of culture and education is $53,700. This is the highest income level of any arts occupation in any industry grouping in the custom data and is an important factor in the high incomes of writers relative to other artists.
Another 36% of writers work in arts, entertainment, and recreation, almost all of whom are independent writers (35%). While the same proportion of all artists work in arts, entertainment, and recreation (36%), only 22% are considered independent artists. The median income of writers in arts, entertainment, and recreation (and the more detailed independent writer grouping) is $23,200.
Another 17% of writers work in information and cultural industries, similar to the proportion of all artists (19%) and much higher than that of all workers (2%). The median income of writers in the cultural industries is $38,600.
Only 3% of writers work in educational services, much lower than the proportion of all artists (20%) and all workers (7%).[8] Figure 9 shows the full distribution of authors and writers by sector.


Key facts about producers, directors, choreographers, and related occupations
This occupation group, which includes individuals who supervise and control artistic activities in various disciplines, is the third-largest arts occupation in Canada. The 27,600 producers, directors, choreographers, and related occupations account for 17% of all artists in Canada.[9]
Key demographic and employment information about producers, directors, and choreographers follows:
- 36% are female, the lowest proportion among the nine arts occupations and much lower than the proportions of all artists (52%) and all workers (48%).
- 50% have a bachelor’s degree or higher, slightly higher than the proportion of all artists (47%) and much higher than that of all workers (28%).
- 39% are 45 years of age or older, lower than the proportions of all artists (46%) and all workers (44%).
- 13% are members of racialized groups, similar to the proportion of all artists (15%) but lower than that of all workers (21%).
- Only 2.2% are Indigenous, compared with 3.1% of all artists and 3.9% of all workers.
- 17% are immigrants to Canada, lower than the proportions of all artists (21%) and all workers (24%).
- 27% speak French most often at home, the highest proportion among the nine arts occupations and much higher than the proportions of all artists (18%) and all workers (21%).
- 38% are self-employed, a low proportion compared with all artists (52%) but much higher than that of all workers (12%).

By almost every measure, this grouping is the best paid among the nine arts occupations. Figure 10 compares the median incomes of producers, directors, and choreographers, all artists, cultural workers, and all workers.
A typical producer, director, or choreographer in Canada has:
- Total individual income of $49,300, about double the median of all artists ($24,300) and higher than that of all workers ($43,500).
- Employment income of $46,000, much higher than the median of all artists ($17,300) and higher than that of all workers ($39,000).
- Household income of $82,900, much higher than the median of all artists ($57,800) but slightly lower than that of all workers ($86,500).

Key statistics about the average incomes of producers, directors, and choreographers follow:
- Total individual income: average of $59,800, much higher than that of all artists ($38,500) and slightly higher than that of all workers ($56,900).
- Employment income: average of $54,900, much higher than that of all artists ($30,700) and slightly higher than that of all workers ($51,100).
- Employment income represents 92% of producers, directors, and choreographers’ individual incomes, compared with 80% of all artists’ individual incomes and 90% of all workers’ incomes.
- Household income: average of $101,900, above the average of all artists ($78,400) but below that of all workers ($108,900).
- The individual incomes of producers, directors, and choreographers represent 59% of their households’ incomes, higher than the equivalent percentages among all artists (49%) and all workers (52%).
Most producers, directors, and choreographers work in the cultural industries
Seventy percent of producers, directors, and choreographers work in information and cultural industries, the highest proportion among the nine arts occupations and much higher than the averages of all artists (20%) and all workers (7%). The median income of producers, directors, and choreographers in the cultural industries is $52,000.
Another 13% work in arts, entertainment, and recreation, a much lower proportion than all artists (36%) but much higher than that of all workers (2%). The median income of producers, directors, and choreographers is $34,800 in this sector.
Only 2% work of producers, directors, and choreographers in educational services, equal to the proportion of all workers but much lower than that of all artists (19%).[10] Figure 11 provides the full distribution of producers, directors, and choreographers by sector.


Key facts about visual artists
The 21,100 visual artists in Canada represent 13% of all artists. Among visual artists:
- 56% are female, higher than the proportions of all artists (52%) and all workers (48%).
- 44% have a bachelor’s degree or higher, slightly lower than the proportion of all artists (47%) but much higher than that of all workers (28%).
- 57% are 45 years of age or older, higher than the proportions of all artists (46%) and all workers (44%). Visual artists are the second-oldest arts occupation.
- 15% are members of racialized groups, equal to the proportion of all artists but lower than that of all workers (21%).
- 1% are Indigenous, higher than the proportion of all artists (3.1%) and similar to that of all workers (3.9%).
- 25% are immigrants to Canada, one of the highest such percentages among the nine arts occupations, higher than the proportion of all artists (21%) and similar to that of all workers (24%).
- 20% speak French most often at home, compared with 18% of all artists and 21% of all workers.
- 66% are self-employed, the highest percentage among the nine arts occupations, and much higher than the proportions of all artists (52%) and all workers (12%).

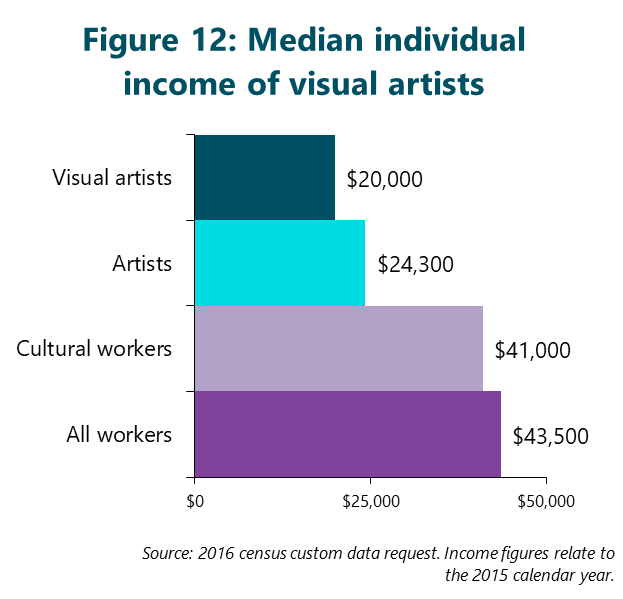
Figure 12 compares the median incomes of visual artists, all artists, cultural workers, and all workers. A typical visual artist in Canada has:
- Total individual income of $20,000, lower than the median of all artists ($24,300) and less than one-half that of all workers ($43,500).
- Employment income of $12,100, lower than the median of all artists ($17,300) and much lower than that of all workers ($39,000).
- Household income of $46,900, below the median of all artists ($57,800) and just over one-half that of all workers ($86,500).
Key statistics about the average incomes of visual artists follow:
- Total individual income: average of $31,700, lower than that of all artists ($38,500) and much lower than that of all workers ($56,900).
- Employment income: average of $21,900, much lower than that of all artists ($30,700) and all workers ($51,100).
- Employment income represents 69% of visual artists’ individual incomes, compared with 80% of all artists’ individual incomes and 90% of all workers’ incomes.
- Household income: average of $61,100, well below the average of all artists ($78,400) and all workers ($108,900).
- The individual incomes of visual artists represent 52% of their households’ incomes, slightly higher than the percentage among all artists (49%) but equal to that of all workers (52%).
Most visual artists are independent artists
Most visual artists work in the arts, entertainment, and recreation industry group (57%). Almost all these visual artists are considered independent artists (54%). The median income of visual artists is just over $17,000 in both the broader industry group and the independent artist sub-group.
One in ten visual artists works in educational services (10%), a much smaller proportion than that of all artists (20%) but slightly higher than that of all workers (7%). The median income of visual artists is just $17,300 in the education sector.[11]
Another 7% of visual artists work in information and cultural industries, much lower than the proportion of all artists (19%) but higher than that of all workers (2%). Figure 13 shows the full distribution of visual artists by sector.


Key facts about artisans and craftspeople
The 14,700 artisans and craftspeople in Canada represent 9% of all artists. Among artisans and craftspeople:
- 59% are female, higher than the proportions of all artists (52%) and all workers (48%).
- 21% have a bachelor’s degree or higher, less than one-half the proportion of all artists (47%) and lower than that of all workers (28%). This is the second-lowest level of bachelor’s degree attainment among the nine arts occupations.
- 63% are 45 years of age or older, much higher than the proportions of all artists (46%) and all workers (44%). Artisans and craftspeople are the oldest arts occupation.
- 14% are members of racialized groups, similar to the proportion of all artists (15%) but much lower than that of all workers (21%).
- 0% are Indigenous, much higher than the proportions of all artists (3.1%) and all workers (3.9%). Artisans and craftspeople have the largest proportion of Indigenous workers among the nine arts occupations.
- 26% are immigrants to Canada, the highest such percentage among the nine arts occupations and higher than the proportions of all artists (21%) and all workers (24%).
- 15% speak French most often at home, compared with 18% of all artists and 21% of all workers.
- 58% are self-employed, higher than the proportions of all artists (52%) and all workers (12%).

Figure 14 compares the median incomes of artisans and craftspeople, all artists, cultural workers, and all workers. A typical artisan and craftsperson in Canada has:
- Total individual income of $20,500, lower than the median of all artists ($24,300) and less than one-half that of all workers ($43,500).
- Employment income of $14,100, lower than the median of all artists ($17,300) and much lower than that of all workers ($39,000).
- Household income of $48,300, below the median of all artists ($57,800) and well below that of all workers ($86,500).

Key statistics about the average incomes of artisans and craftspeople follow:
- Total individual income: average of $28,200, lower than the average of all artists ($38,500) and much lower than that of all workers ($56,900).
- Employment income: average of $20,600, much lower than those of all artists ($30,700) and all workers ($51,100).
- Employment income represents 73% of artisans and craftspeople’s individual incomes, compared with 80% of artists’ individual incomes and 90% of all workers’ incomes.
- Household income: average of $64,200, below the averages of all artists ($78,400) and all workers ($108,900).
- The individual incomes of artisans and craftspeople represent 44% of their households’ incomes, lower than the equivalent percentages among all artists (49%) and all workers (52%).
Most artisans and craftspeople work outside of cultural sectors
Four out of every five artisans and craftspeople work in industries other than the three cultural and educational sectors highlighted in this report (80%, compared with just 26% of all artists). Many artisans and craftspeople are classified within the manufacturing and retail trade industries. The median income of artisans and craftspeople working outside of culture and education is $21,900.
Another 18% of artisans and craftspeople work in arts, entertainment, and recreation, almost all of whom are independent artists (17%). In comparison, 36% of all artists work in arts, entertainment, and recreation, and 22% are considered independent artists. The median income of artisans and craftspeople in arts, entertainment, and recreation (and the more detailed independent artist grouping) is $15,300.
Only 2% of artisans and craftspeople work in educational services, much lower than the proportions of all artists (20%) and all workers (7%).[12]
No artisans and craftspeople work in information and cultural industries, compared with 19% of all artists and 2% of all workers. Figure 15 provides the full distribution of artisans and craftspeople by sector.


Key facts about actors and comedians
Of the 11,400 actors and comedians (7% of all artists) in Canada:
- 47% are female, lower than the proportion of all artists (52%) but similar to that of all workers (48%).
- 37% have a bachelor’s degree or higher, lower than the proportion of all artists (47%) but higher than that of all workers (28%).
- 34% are 45 years of age or older, lower than the proportions of all artists (46%) and all workers (44%).
- 18% are members of racialized groups, one of the highest such proportions among the nine arts occupations, higher than the proportion of all artists (15%) but lower than that of all workers (21%).
- 0% are Indigenous, higher than the proportion of all artists (3.1%) and similar to that of all workers (3.9%).
- 18% are immigrants to Canada, compared with 21% of all artists and 24% of all workers.
- 17% speak French most often at home, compared with 18% of all artists and 21% of all workers.
- 44% are self-employed, lower than the proportion of all artists (52%) but much higher than that of all workers (12%).

Figure 16 compares the median incomes of actors and comedians, all artists, cultural workers, and all workers. A typical actor or comedian in Canada has:
- Total individual income of $18,500, lower than the median of all artists ($24,300) and less than one-half that of all workers ($43,500).
- Employment income of $11,900, much lower than the medians of all artists ($17,300) and all workers ($39,000).
- Household income of $41,500, below the median of all artists ($57,800) and less than one-half of the median of all workers ($86,500).

Key statistics about the average incomes of actors and comedians follow:
- Total individual income: average of $30,800, lower than the average of all artists ($38,500) and much lower than that of all workers ($56,900).
- Employment income: average of $23,500, much lower than those of all artists ($30,700) and all workers ($51,100).
- Employment income represents 76% of the individual incomes of actors and comedians, compared with 80% of all artists’ incomes and 90% of all workers’ incomes.
- Household income: average of $64,600, below the averages of all artists ($78,400) and all workers ($108,900).
- The individual incomes of actors and comedians represent 48% of their households’ incomes, similar to the percentage among all artists (49%) but lower than that of all workers (52%).
Many actors and comedians are independent artists
Over one-half of actors and comedians (59%) work in arts, entertainment, and recreation, many of whom work as independent artists (36%). The median income of actors and comedians in the arts, entertainment, and recreation industry group is just $19,100.
One-quarter of actors and comedians (25%) work in information and cultural industries, such as the film industry. This proportion is much higher than those of all artists (19%) and all workers (2%). The median income of actors and comedians in the cultural industries is just $16,800.
Only 8% of actors and comedians work in educational services, much lower than the average of all artists (20%) but similar to the proportion of all workers (7%).[13] Figure 17 shows their full distribution by sector.


Key facts about dancers
The 10,100 dancers in Canada represent 6% of all artists. Among dancers:
- 86% are female, by far the highest proportion of the nine arts occupations and much higher than the proportions of all artists (52%) and all workers (48%).
- Just 25% have a bachelor’s degree or higher, much lower than the proportion of all artists (47%) and slightly lower than that of all workers (28%).
- Only 20% are 45 years of age or older, by far the lowest proportion of the nine arts occupations and less than one-half the proportions of all artists (46%) and all workers (44%). In contrast, 39% of dancers are between 15 and 24 years of age, much higher than the proportions of all artists (11%) and all workers (14%).
- 15% are members of racialized groups, equal to the proportion of all artists but below that of all workers (21%).
- 3% are Indigenous, similar to the proportion of all artists (3.1%) but lower than that of all workers (3.9%).
- 16% are immigrants to Canada, lower than the proportions of all artists (21%) and all workers (24%).
- 17% speak French most often at home, compared with 18% of all artists and 21% of all workers.
- 35% are self-employed, lower than the proportion of all artists (52%) but much higher than that of all workers (12%).

Figure 18 compares the median incomes of dancers, all artists, cultural workers, and all workers. A typical dancer in Canada has:
- Total individual income of $15,800, the lowest median income of all nine arts occupations and much lower than the medians of all artists ($24,300) and all workers ($43,500).
- Employment income of $11,500, lower than the median of all artists ($17,300) and much lower than that of all workers ($39,000).
- Household income of $42,400, below the median of all artists ($57,800) and one-half of the median of all workers ($86,500).

Key statistics about dancers’ average incomes follow:
- Total individual income: average of $22,100, much lower than the averages of all artists ($38,500) and all workers ($56,900).
- Employment income: average of $17,100, much lower than those of all artists ($30,700) and all workers ($51,100).
- Employment income represents 77% of dancers’ individual incomes, similar to the percentage for all artists (80%) but lower than that of all workers (90%).
- Household income: average of $62,700, below the averages of all artists ($78,400) and all workers ($108,900).
- The individual incomes of dancers represent 35% of their households’ incomes, much lower than the equivalent percentages among all artists (49%) and all workers (52%).
Most dancers teach for a living
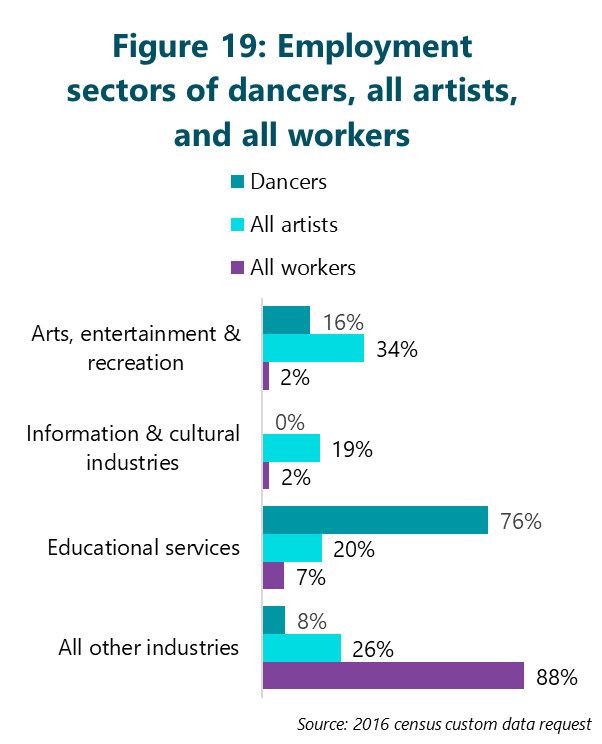
Three-quarters of dancers (76%) work in educational services, the highest such percentage among the nine arts occupations and much higher than the averages of all artists (20%) and all workers (7%). The median income of dance teachers is just $15,700.[14]
About one in every six dancers (16%) works in arts, entertainment, and recreation, one-half of whom work for performing arts companies (8% of all dancers). The median income of dancers in the arts, entertainment, and recreation industry group is just $17,000 (and is $19,100 in performing arts companies).
No dancers were categorized as working in information and cultural industries, compared with 19% of all artists (19%) and 2% of all workers. Figure 19 provides the full distribution of dancers by sector.

Key facts about other types of performers
The 6,400 artists in this occupation group (which includes circus performers, magicians, puppeteers, models, and others) represent 4% of all artists. Among these other performers:
- 48% are female, lower than the proportion of all artists (52%) but equal to that of all workers (48%).
- Just 18% have a bachelor’s degree or higher, the lowest percentage among the nine arts occupations and much lower than the proportions of all artists (47%) and all workers (28%).
- Only 26% are 45 years of age or older, much lower than the proportions of all artists (46%) and all workers (44%). In contrast, 24% of other performers are between 15 and 24 years of age, much higher than the proportions of all artists (11%) and all workers (14%).
- 19% are members of racialized groups, the highest such percentage among the nine arts occupations, higher than the proportion of all artists (15%) and similar to that of all workers (21%).
- 3% are Indigenous, higher than the proportions of all artists (3.1%) and all workers (3.9%).
- 17% are immigrants to Canada, lower than the proportions of all artists (21%) and all workers (24%).
- 19% speak French most often at home, similar to the proportions of all artists (18%) and all workers (21%).
- 47% are self-employed, lower than the proportion of all artists (52%) but much higher than that of all workers (12%).

Figure 20 compares the median incomes of other performers, all artists, cultural workers, and all workers. A typical other performer in Canada has:
- Total individual income of $16,900, much lower than the medians of all artists ($24,300) and all workers ($43,500).
- Employment income of $13,200, lower than the median of all artists ($17,300) and much lower than that of all workers ($39,000).
- Household income of $41,000, below the median of all artists ($57,800) and less than one-half that of all workers ($86,500).

Key statistics about other performers’ average incomes follow:
- Total individual income: average of $34,600, lower than the average of all artists ($38,500) and much lower than that of all workers ($56,900).
- Employment income: average of $24,500, lower than that of all artists ($30,700) and much lower than all workers ($51,100).
- Employment income represents 71% of other performers’ individual incomes, lower than the percentages for all artists (80%) and all workers (90%).
- Household income: average of $79,400, similar to the average of all artists ($78,400) but much lower than that of all workers ($108,900).
- The individual incomes of other performers represent 44% of their households’ incomes, lower than the equivalent percentages among all artists (49%) and all workers (52%).
Many other performers are independent artists
Almost two-thirds of other performers (63%) work in arts, entertainment, and recreation, and just over one-half of these performers work as independent artists (36% of all other performers). The median income of other performers in the arts, entertainment, and recreation industry group is just $16,200 (and just $15,100 for independent artists).
Only very small proportions of other performers work in information and cultural industries (7%, compared with 19% of all artists) or educational services (3%, compared with 20% of all artists).[15]
The remaining 27% of other performers work in all industries other than the cultural and educational industries noted above (equal to the proportion of all artists). Figure 21 provides the full distribution of other performers by sector.


Key facts about conductors, composers, and arrangers
Conductors, composers, and arrangers are a very small group of artists: 4,200 workers, just 3% of all artists. Key demographic and employment information about conductors, composers, and arrangers follows:
- 37% are female, much lower than the proportions of all artists (52%) and all workers (48%).
- 53% have a bachelor’s degree or higher, higher than the proportion of all artists (47%) and much higher than that of all workers (28%).
- 53% are 45 years of age or older, higher than the proportions of all artists (46%) and all workers (44%).
- 12% are members of racialized groups, lower than the proportion of all artists (15%) and much lower than that of all workers (21%).
- Only 2.4% are Indigenous, compared with 3.1% of all artists and 3.9% of all workers.
- 18% are immigrants to Canada, lower than the proportions of all artists (21%) and all workers (24%).
- 23% speak French most often at home, higher than the proportion of all artists (18%) and similar to that of all workers (21%).
- 53% are self-employed, similar to the proportion of all artists (52%) and much higher than that of all workers (12%).

Figure 22 compares the median incomes of conductors, composers, and arrangers, all artists, cultural workers, and all workers. A typical conductor, composer, and arranger in Canada has:
- Total individual income of $29,700, higher than the median of all artists ($24,300) but below that of all workers ($43,500).
- Employment income of $18,000, slightly higher than the median of all artists ($17,300) but less than one-half of that of all workers ($39,000).
- Household income of $57,800, equal to the median of all artists but much lower than that of all workers ($86,500).

Key statistics about the average incomes of conductors, composers, and arrangers follow:
- Total individual income: average of $42,800, higher than that of all artists ($38,500) but lower than that of all workers ($56,900).
- Employment income: average of $30,200, essentially equal to the average of all artists ($30,700) but much lower than that of all workers ($51,100).
- Employment income represents 71% of conductors, composers, and arrangers’ individual incomes, compared with 80% of all artists’ individual incomes and 90% of all workers’ incomes.
- Household income: average of $77,400, essentially equal to the average of all artists ($78,400) but below that of all workers ($108,900).
- The individual incomes of conductors, composers, and arrangers represent 55% of their households’ incomes, higher than the equivalent percentages among all artists (49%) and all workers (52%).
One-half conductors, composers, and arrangers work in the arts and entertainment industry
Exactly one-half of conductors, composers, and arrangers (50%) work in arts, entertainment, and recreation. These artists are split between performing arts companies (27% of all conductors, composers, and arrangers) and independent artists (20%). The median income of conductors, composers, and arrangers in arts, entertainment, and recreation is $23,900 and is higher for those working in performing arts companies ($24,400) than for independent artists ($22,000).
About one in every six conductors, composers, and arrangers (16%) works in information and cultural industries, such as the film industry. This proportion is slightly lower than that of all artists (19%) but much higher than that of all workers (2%). The median income of conductors, composers, and arrangers in the cultural industries is particularly high: $40,500.
Only 6% of conductors, composers, and arrangers work in educational services, much lower than the average for all artists (20%) but similar to the proportion of all workers (7%).[16] Figure 23 shows the full distribution of conductors, composers, and arrangers by sector.


| Key statistics on artists and cultural workers in Canada (2016 census) | ||||||||||||
| Statistic | Musicians & singers | Authors & writers | Producers, directors, choreographers & related | Painters, sculptors & other visual artists | Artisans & craftspeople | Actors & comedians | Dancers | Other performers | Conductors, composers & arrangers | All artists | Cultural workers | All workers |
| Number (experienced labour force) | 35,005 | 27,695 | 27,595 | 21,055 | 14,720 | 11,370 | 10,145 | 6,350 | 4,190 | 158,130 | 726,630 | 18,268,120 |
| Income statistics | ||||||||||||
| Median individual income | $17,858 | $40,042 | $49,317 | $20,011 | $20,528 | $18,509 | $15,755 | $16,907 | $29,702 | $24,294 | $40,971 | $43,484 |
| Median employment income | $12,251 | $31,810 | $46,046 | $12,137 | $14,121 | $11,917 | $11,516 | $13,216 | $17,984 | $17,331 | $37,211 | $38,997 |
| Median household income | $44,582 | $73,430 | $82,949 | $46,862 | $48,344 | $41,524 | $42,405 | $41,037 | $57,831 | $57,796 | $75,353 | $86,460 |
| Average individual income | $27,479 | $50,259 | $59,836 | $31,707 | $28,241 | $30,813 | $22,116 | $34,559 | $42,785 | $38,455 | $48,833 | $56,872 |
| Average employment income | $19,562 | $40,538 | $54,900 | $21,896 | $20,633 | $23,476 | $17,069 | $24,512 | $30,169 | $30,740 | $44,045 | $51,091 |
| Average household income | $63,025 | $93,925 | $101,903 | $61,133 | $64,190 | $64,575 | $62,714 | $79,360 | $77,374 | $78,403 | $92,034 | $108,920 |
| Percentage by sex | ||||||||||||
| Women | 52% | 55% | 36% | 56% | 59% | 47% | 86% | 48% | 37% | 52% | 51% | 48% |
| Men | 48% | 45% | 64% | 44% | 41% | 53% | 14% | 52% | 63% | 48% | 49% | 52% |
| Highest certificate, diploma or degree | ||||||||||||
| No certificate, diploma or degree | 6% | 1% | 2% | 7% | 14% | 6% | 14% | 13% | 4% | 6% | 4% | 10% |
| Secondary (high) school diploma or equivalency certificate | 23% | 10% | 16% | 21% | 27% | 27% | 35% | 37% | 24% | 21% | 17% | 26% |
| Apprenticeship or trades certificate or diploma | 2% | 2% | 3% | 6% | 10% | 3% | 5% | 6% | 2% | 4% | 5% | 11% |
| College, CEGEP or other non-university certificate or diploma | 16% | 17% | 29% | 22% | 24% | 26% | 21% | 22% | 17% | 21% | 27% | 22% |
| University certificate or diploma below bachelor level | 1% | 0% | 1% | 1% | 4% | 1% | 0% | 4% | 1% | 1% | 3% | 3% |
| University certificate, diploma or degree at bachelor level or above | 52% | 69% | 50% | 44% | 21% | 37% | 25% | 18% | 53% | 47% | 43% | 28% |
| Age | ||||||||||||
| 15 to 24 years | 14% | 5% | 6% | 6% | 5% | 17% | 39% | 24% | 7% | 11% | 10% | 14% |
| 25 to 34 years | 21% | 20% | 28% | 18% | 15% | 28% | 26% | 31% | 20% | 22% | 27% | 21% |
| 35 to 44 years | 19% | 22% | 28% | 19% | 17% | 22% | 15% | 18% | 20% | 21% | 23% | 21% |
| 45 to 54 years | 18% | 22% | 22% | 20% | 24% | 17% | 9% | 15% | 21% | 20% | 20% | 23% |
| 55 to 64 years | 19% | 19% | 13% | 23% | 26% | 11% | 7% | 9% | 19% | 17% | 15% | 17% |
| 65 years and older | 10% | 12% | 3% | 14% | 13% | 7% | 4% | 3% | 13% | 9% | 5% | 4% |
| All 45 and older | 46% | 52% | 39% | 57% | 63% | 34% | 20% | 26% | 53% | 46% | 40% | 44% |
| Indigenous identity | ||||||||||||
| Indigenous | 1.9% | 2.3% | 2.2% | 4.1% | 7.0% | 4.0% | 3.3% | 4.3% | 2.4% | 3.1% | 2.7% | 3.9% |
| Not Indigenous | 98% | 98% | 98% | 96% | 93% | 96% | 97% | 96% | 98% | 97% | 97% | 96% |
| Racialized groups (visible minority) | ||||||||||||
| Racialized | 17% | 13% | 13% | 15% | 14% | 18% | 15% | 19% | 12% | 15% | 18% | 21% |
| Not racialized | 83% | 87% | 87% | 85% | 87% | 82% | 85% | 81% | 88% | 85% | 82% | 79% |
| Immigrant status and period of immigration | ||||||||||||
| Non-immigrants | 77% | 78% | 81% | 73% | 73% | 81% | 82% | 82% | 81% | 78% | 77% | 75% |
| Immigrants | 21% | 21% | 17% | 25% | 26% | 18% | 16% | 17% | 18% | 21% | 21% | 24% |
| Before 1981 | 5% | 7% | 4% | 8% | 8% | 5% | 3% | 3% | 5% | 6% | 4% | 4% |
| 1981 to 1990 | 3% | 3% | 3% | 3% | 4% | 2% | 1% | 2% | 3% | 3% | 3% | 3% |
| 1991 to 2000 | 6% | 4% | 4% | 5% | 5% | 4% | 4% | 4% | 4% | 5% | 5% | 6% |
| 2001 to 2010 | 6% | 4% | 4% | 6% | 6% | 4% | 6% | 4% | 4% | 5% | 6% | 7% |
| 2011 to 2016 | 2% | 2% | 2% | 3% | 2% | 2% | 2% | 3% | 2% | 2% | 3% | 3% |
| Non-permanent residents | 1% | 1% | 2% | 2% | 1% | 1% | 2% | 2% | 2% | 2% | 2% | 1% |
| Language spoken most often at home | ||||||||||||
| English (alone or in combination) | 77% | 83% | 71% | 72% | 74% | 80% | 79% | 77% | 73% | 76% | 72% | 70% |
| French (alone or in combination) | 15% | 14% | 27% | 20% | 15% | 17% | 17% | 19% | 23% | 18% | 21% | 21% |
| Non-official (alone or in combination) | 12% | 6% | 5% | 11% | 14% | 6% | 8% | 8% | 6% | 9% | 10% | 14% |
| Class of worker | ||||||||||||
| Self-employed (incorporated or unincorporated) | 60% | 51% | 38% | 66% | 58% | 44% | 35% | 47% | 53% | 52% | 26% | 12% |
| Employee | 39% | 49% | 62% | 33% | 41% | 56% | 64% | 53% | 46% | 48% | 73% | 88% |
| Unpaid family worker | 0% | 1% | 0% | 1% | 1% | 0% | 0% | 0% | 1% | 0% | 0% | 0% |
| Industry – North American Industry Classification System (NAICS) 2012 | ||||||||||||
| 71 Arts, entertainment and recreation | 34% | 36% | 13% | 57% | 18% | 59% | 16% | 63% | 50% | 34% | 12% | 2% |
| 7111 Performing arts companies | 29% | 1% | 6% | 1% | 0% | 15% | 8% | 12% | 27% | 11% | 3% | 0% |
| 7115 Independent artists, writers and performers | 3% | 34% | 4% | 54% | 17% | 36% | 4% | 36% | 20% | 21% | 6% | 0% |
| 51 Information and cultural industries | 2% | 17% | 70% | 7% | 0% | 25% | 0% | 7% | 16% | 19% | 20% | 2% |
| 61 Educational services | 53% | 3% | 2% | 10% | 2% | 8% | 76% | 3% | 6% | 20% | 7% | 7% |
| All other industries (excludes 51, 61 and 71) | 11% | 44% | 15% | 25% | 80% | 8% | 8% | 27% | 28% | 26% | 60% | 88% |
| Weeks worked full/part time | ||||||||||||
| Did not work in 2015 | 3% | 3% | 1% | 4% | 4% | 7% | 3% | 5% | 2% | 3% | 2% | 3% |
| 1 to 26 weeks | 14% | 14% | 10% | 17% | 17% | 36% | 20% | 25% | 10% | 16% | 14% | 13% |
| 1 to 26 weeks, full time | 2% | 5% | 5% | 5% | 5% | 7% | 3% | 4% | 4% | 4% | 6% | 7% |
| 1 to 26 weeks, part time | 12% | 9% | 5% | 12% | 12% | 29% | 17% | 20% | 7% | 12% | 7% | 6% |
| 27 to 39 weeks | 17% | 7% | 8% | 11% | 8% | 12% | 19% | 12% | 8% | 12% | 8% | 7% |
| 27 to 39 weeks, full time | 3% | 4% | 6% | 4% | 3% | 4% | 4% | 4% | 3% | 4% | 5% | 5% |
| 27 to 39 weeks, part time | 14% | 4% | 2% | 7% | 4% | 8% | 15% | 9% | 6% | 8% | 3% | 3% |
| 40 to 52 weeks | 65% | 76% | 81% | 68% | 71% | 45% | 59% | 59% | 79% | 69% | 76% | 77% |
| 40 to 52 weeks, full time | 29% | 59% | 74% | 48% | 52% | 26% | 27% | 34% | 53% | 47% | 64% | 66% |
| 40 to 52 weeks, part time | 36% | 17% | 7% | 20% | 19% | 19% | 31% | 25% | 26% | 22% | 12% | 11% |
| Number by sex | ||||||||||||
| Women | 18,245 | 15,325 | 9,845 | 11,745 | 8,680 | 5,350 | 8,715 | 3,035 | 1,535 | 82,475 | 373,280 | 8,734,000 |
| Men | 16,765 | 12,370 | 17,745 | 9,310 | 6,040 | 6,020 | 1,430 | 3,315 | 2,655 | 75,655 | 353,350 | 9,534,120 |
| Highest certificate, diploma or degree | ||||||||||||
| No certificate, diploma or degree | 2,025 | 410 | 470 | 1,435 | 2,025 | 675 | 1,420 | 815 | 175 | 9,455 | 28,055 | 1,904,945 |
| Secondary (high) school diploma or equivalency certificate | 8,200 | 2,900 | 4,375 | 4,355 | 4,035 | 3,085 | 3,540 | 2,370 | 985 | 33,845 | 127,025 | 4,696,015 |
| Apprenticeship or trades certificate or diploma | 775 | 495 | 750 | 1,190 | 1,440 | 360 | 510 | 380 | 85 | 5,980 | 37,120 | 1,942,660 |
| College, CEGEP or other non-university certificate or diploma | 5,540 | 4,720 | 7,965 | 4,695 | 3,505 | 2,950 | 2,095 | 1,410 | 695 | 33,580 | 199,270 | 4,064,940 |
| University certificate or diploma below bachelor level | 325 | 85 | 180 | 160 | 545 | 75 | 50 | 225 | 25 | 1,665 | 22,720 | 542,310 |
| University certificate, diploma or degree at bachelor level or above | 18,140 | 19,080 | 13,855 | 9,220 | 3,160 | 4,225 | 2,525 | 1,145 | 2,230 | 73,600 | 312,445 | 5,117,255 |
| Age | ||||||||||||
| 15 to 24 years | 5,070 | 1,345 | 1,585 | 1,270 | 730 | 1,890 | 3,925 | 1,555 | 280 | 17,650 | 72,305 | 2,472,540 |
| 25 to 34 years | 7,225 | 5,655 | 7,710 | 3,745 | 2,165 | 3,150 | 2,600 | 1,950 | 825 | 35,025 | 194,740 | 3,839,090 |
| 35 to 44 years | 6,520 | 6,165 | 7,655 | 4,055 | 2,500 | 2,485 | 1,565 | 1,160 | 840 | 32,940 | 166,695 | 3,857,575 |
| 45 to 54 years | 6,235 | 6,140 | 6,050 | 4,255 | 3,580 | 1,880 | 935 | 930 | 880 | 30,890 | 147,980 | 4,195,960 |
| 55 to 64 years | 6,550 | 5,170 | 3,635 | 4,865 | 3,890 | 1,225 | 720 | 545 | 800 | 27,405 | 109,915 | 3,104,010 |
| 65 years and older | 3,400 | 3,220 | 965 | 2,875 | 1,850 | 740 | 400 | 200 | 560 | 14,215 | 35,000 | 798,950 |
| All 45 and older | 16,185 | 14,530 | 10,650 | 11,995 | 9,320 | 3,845 | 2,055 | 1,675 | 2,240 | 72,510 | 292,895 | 8,098,920 |
| Indigenous identity | ||||||||||||
| Indigenous | 655 | 640 | 620 | 860 | 1,030 | 455 | 335 | 270 | 100 | 4,965 | 19,445 | 716,605 |
| Not Indigenous | 34,350 | 27,055 | 26,970 | 20,200 | 13,690 | 10,920 | 9,810 | 6,075 | 4,090 | 153,160 | 707,190 | 17,551,520 |
| Racialized groups (visible minority) | ||||||||||||
| Member of a racialized group | 5,840 | 3,545 | 3,465 | 3,160 | 1,990 | 2,095 | 1,485 | 1,185 | 500 | 23,265 | 128,680 | 3,896,330 |
| Not member of a racialized group | 29,160 | 24,155 | 24,125 | 17,895 | 12,730 | 9,280 | 8,655 | 5,165 | 3,690 | 134,860 | 597,955 | 14,371,790 |
| Immigrant status and period of immigration | ||||||||||||
| Non-immigrants | 27,070 | 21,610 | 22,390 | 15,300 | 10,800 | 9,180 | 8,330 | 5,180 | 3,385 | 123,250 | 558,270 | 13,688,910 |
| Immigrants | 7,495 | 5,720 | 4,735 | 5,250 | 3,805 | 2,040 | 1,600 | 1,065 | 740 | 32,445 | 154,385 | 4,322,270 |
| Before 1981 | 1,595 | 2,030 | 1,185 | 1,615 | 1,225 | 595 | 255 | 215 | 205 | 8,925 | 31,745 | 735,450 |
| 1981 to 1990 | 1,070 | 750 | 695 | 675 | 625 | 250 | 145 | 155 | 130 | 4,485 | 22,620 | 624,795 |
| 1991 to 2000 | 2,065 | 1,035 | 1,055 | 1,090 | 780 | 460 | 355 | 255 | 155 | 7,245 | 36,175 | 1,050,440 |
| 2001 to 2010 | 2,000 | 1,245 | 1,205 | 1,230 | 810 | 495 | 610 | 255 | 180 | 8,040 | 41,940 | 1,275,000 |
| 2011 to 2016 | 765 | 655 | 600 | 640 | 360 | 240 | 235 | 180 | 70 | 3,745 | 21,900 | 636,585 |
| Non-permanent residents | 440 | 370 | 465 | 505 | 115 | 150 | 205 | 105 | 65 | 2,430 | 13,975 | 256,940 |
| Language spoken most often at home | ||||||||||||
| English (alone or in combination) | 26,785 | 22,890 | 19,505 | 15,250 | 10,960 | 9,075 | 8,030 | 4,885 | 3,055 | 120,430 | 522,590 | 12,735,730 |
| French (alone or in combination) | 5,370 | 3,830 | 7,350 | 4,120 | 2,200 | 1,915 | 1,690 | 1,195 | 955 | 28,625 | 155,625 | 3,769,585 |
| Non-official (alone or in combination) | 4,110 | 1,615 | 1,490 | 2,300 | 2,050 | 735 | 820 | 500 | 265 | 13,890 | 75,125 | 2,646,560 |
| Class of worker | ||||||||||||
| Self-employed (incorporated or unincorporated) | 21,135 | 14,065 | 10,385 | 14,000 | 8,610 | 5,005 | 3,580 | 2,980 | 2,230 | 81,980 | 190,625 | 2,138,055 |
| Employee | 13,770 | 13,500 | 17,165 | 6,925 | 5,990 | 6,335 | 6,540 | 3,370 | 1,930 | 75,520 | 534,015 | 16,073,685 |
| Unpaid family worker | 105 | 140 | 45 | 130 | 115 | 35 | 30 | 0 | 35 | 630 | 1,995 | 56,380 |
| Industry – North American Industry Classification System (NAICS) 2012 | ||||||||||||
| 71 Arts, entertainment and recreation | 11,770 | 9,855 | 3,640 | 12,025 | 2,620 | 6,710 | 1,640 | 3,970 | 2,075 | 54,290 | 86,770 | 379,740 |
| 7111 Performing arts companies | 10,285 | 240 | 1,675 | 265 | 60 | 1,690 | 835 | 780 | 1,130 | 16,950 | 21,860 | 29,295 |
| 7115 Independent artists, writers and performers | 1,105 | 9,420 | 1,115 | 11,305 | 2,485 | 4,115 | 390 | 2,260 | 855 | 33,055 | 41,125 | 47,100 |
| 51 Information and cultural industries | 785 | 4,790 | 19,310 | 1,560 | 40 | 2,835 | 25 | 435 | 690 | 30,470 | 148,820 | 420,355 |
| 61 Educational services | 18,660 | 845 | 620 | 2,135 | 330 | 875 | 7,715 | 215 | 265 | 31,655 | 53,075 | 1,346,585 |
| All other industries (excludes 51, 61 and 71) | 3,785 | 12,210 | 4,030 | 5,340 | 11,735 | 960 | 765 | 1,725 | 1,160 | 41,705 | 437,965 | 16,121,445 |
| Weeks worked full/part time | ||||||||||||
| Did not work in 2015 | 1,045 | 815 | 340 | 745 | 570 | 755 | 260 | 290 | 100 | 4,930 | 17,910 | 494,580 |
| 1 to 26 weeks | 5,040 | 3,930 | 2,745 | 3,560 | 2,545 | 4,110 | 2,020 | 1,560 | 430 | 25,940 | 98,105 | 2,454,305 |
| 1 to 26 weeks, full time | 690 | 1,335 | 1,500 | 1,060 | 715 | 820 | 275 | 260 | 155 | 6,800 | 46,570 | 1,274,940 |
| 1 to 26 weeks, part time | 4,350 | 2,595 | 1,250 | 2,500 | 1,830 | 3,290 | 1,750 | 1,300 | 280 | 19,135 | 51,540 | 1,179,365 |
| 27 to 39 weeks | 6,120 | 2,025 | 2,155 | 2,355 | 1,110 | 1,400 | 1,900 | 780 | 345 | 18,205 | 57,970 | 1,285,195 |
| 27 to 39 weeks, full time | 1,105 | 990 | 1,530 | 910 | 500 | 500 | 365 | 225 | 115 | 6,245 | 32,955 | 822,305 |
| 27 to 39 weeks, part time | 5,015 | 1,040 | 625 | 1,440 | 610 | 900 | 1,535 | 555 | 235 | 11,955 | 25,020 | 462,890 |
| 40 to 52 weeks | 22,800 | 20,925 | 22,350 | 14,395 | 10,495 | 5,105 | 5,965 | 3,715 | 3,310 | 109,060 | 552,645 | 14,034,040 |
| 40 to 52 weeks, full time | 10,165 | 16,240 | 20,330 | 10,160 | 7,670 | 2,945 | 2,775 | 2,155 | 2,210 | 74,650 | 462,050 | 12,007,280 |
| 40 to 52 weeks, part time | 12,630 | 4,685 | 2,020 | 4,235 | 2,820 | 2,155 | 3,190 | 1,565 | 1,105 | 34,415 | 90,595 | 2,026,760 |
 Because of major methodological changes between the 2011 National Household Survey and the 2016 long-form census, data in this report are not comparable to data in previous reports in the Statistical Insights on the Arts series. The National Household Survey was voluntary, while the long-form census is mandatory. The census was completed by 25% of all Canadian households.
Compared with even older reports in the Statistical Insights on the Arts series (using 2001 and 2006 long-form census data), there has been a change in the base population analyzed for this report. This report examines the experienced labour force, which includes all those who worked as an artist during the census reference week or worked as an artist longer than any other position since January 1, 2015. Reports from 2006 excluded respondents with no income, while this report places no restriction on incomes.
There are other important aspects about the classification of artists in census data:
- Canadians 15 or older are classified in the occupation in which they worked the most hours during the census reference week (May 1 to 7, 2016). If they were unemployed during that week, they are classified based on the job at which they worked the longest since January 1, 2015. If they did not work at all during that period, or if they were not in the labour force during the reference week, they are excluded from the experienced labour force (and the statistics in this report).
- Artists who spent more time at another occupation than at their artwork during the reference week would be categorized in the other occupation. The census does not capture information about secondary occupations.
- Each occupation includes individuals who are employed or self-employed.
- Artists who teach in post-secondary, secondary, or elementary schools are classified as professors or teachers, not in artistic occupations. Instructors and teachers in some settings (such as private arts schools, academies, and conservatories) are included as “artists”.
- The 2016 census collected income information for 2015, the most recent calendar year.
- Total incomes include wages and salaries, net self-employment income, investment income, retirement pensions, other income sources (a category that includes artists’ project grants), as well as government transfer payments.
- Employment income statistics include amounts received from all employment and self-employment positions in 2015, not just the position at which the respondent worked the most hours during the reference week. In some cases, individuals may have worked in a different occupation in 2015 (the basis for earnings statistics) than the one in which they worked the most hours during the census reference week (May 1 to 7, 2016 – the basis for occupational classifications). In these cases, the earnings would have been based on the other occupation.
- The report highlights artists’ situations in the three most common sectors for artists: 1) arts, entertainment, and recreation; 2) educational services; and 3) information and cultural industries.
- Because of major changes in methods between the 2011 National Household Survey and the 2016 census, data in this report are not comparable to previous reports. Subsequent reports will examine artists in the provinces and local areas, as well as demographic differences in the situations of artists.
Choice of nine arts occupations
In this report, the term “artists” is used to describe those Canadians 15 or older classified into nine occupation groups:
- Actors and comedians
- Artisans and craftspersons
- Authors and writers
- Conductors, composers and arrangers
- Dancers
- Musicians and singers
- Other performers (including circus performers, magicians, models, puppeteers, and other performers not elsewhere classified)
- Producers, directors, choreographers, and related occupations
- Visual artists (categorized by Statistics Canada as “painters, sculptors and other visual artists”)
These occupation groups were identified as artistic in discussions by arts sector representatives prior to the analysis of the 2001 census. These nine occupation groups were selected for inclusion in the Statistical Insights on the Arts series during discussions between Hill Strategies Research and the project funders: the Canada Council for the Arts, the Ontario Arts Council, and the Department of Canadian Heritage.
In general, the nine occupations were selected as “artists” on the basis of the artistic nature of the occupations, based on occupation titles and descriptions.
Strengths and limitations of census data for counting artists
The 2016 long-form census is one of the best available sources of information on artists in Canada. The census provides occupation estimates based on a very large population base: the 3.7 million households that completed the long-form version of the census.[17] This allows for a fine-grained analysis of the situations of artists in many jurisdictions across the country.
However, there are strong limitations to census data on artists, related to the focus on the job where an individual worked the most hours, the timing of the census, and the nature of the standard occupational classifications.
The focus on the job where the individual worked the most hours affects census labour force counts. Having multiple jobs is an important facet of the working life of many artists. Some may work more hours at other jobs during the week than at their art. Due to this, census-based estimates of artists are likely to be somewhat low.
A gap in the Statistics Canada occupational classification is the fact that there is no distinct category for filmmakers or other media artists. The closest categories are “Producers, directors, choreographers, and related occupations” (which includes a number of artforms), “film and video camera operators” (not one of the nine arts occupations), and “painters, sculptors, and other visual artists”.
Another example of an occupation group that is not a perfect fit for artists is the authors and writers category. This occupation group includes a broader range of writers than simply novelists, poets and other “artistic” writers (but excludes journalists).
Another issue is the timing of the census. The classification of occupations is based on the job that respondents spend the most hours at during the week of Sunday, May 1 to Saturday, May 7, 2016. This is an “in between” period for many artistic endeavors. For example, many performing arts organizations have seasons that extend from the fall to the spring. These seasons may be finished before the week of May 1, leaving some artists to find other employment during the late spring and summer. Other organizations may have summer seasons that do not begin in early May.
Demographic questions
A few important notes regarding the availability and nature of some demographic questions in the 2016 census follow.[18]
The census included questions about:
- Sex: The census included a “binary” question regarding sex, with just two response options: “What is this person’s sex? Male; Female”.
- Aboriginal people (referred to as Indigenous in this report): “Is this person an Aboriginal person, that is, First Nations (North American Indian), Métis or Inuk (Inuit)?”
- Racialized Canadians: Statistics Canada identified certain groups as being from a “visible minority”, referred to as “racialized” in this report, based on a question about respondents’ backgrounds: “Is this person: Mark more than one circle or specify, if applicable.; White; South Asian (e.g., East Indian, Pakistani, Sri Lankan, etc.); Chinese; Black; Filipino; Latin American; Arab; Southeast Asian (e.g., Vietnamese, Cambodian, Laotian, Thai, etc.); West Asian (e.g., Iranian, Afghan, etc.); Korean; Japanese; Other — specify”.
- Language spoken most often at home: “What language does this person speak most often at home? English; French; Other language — specify”. People could select multiple languages if they were used equally often. For the custom dataset, these multiple selections were counted in each of the language groups. In other words, the combination of English + French + other is more than 100% in the dataset.
- Immigrants to Canada: “Are you now, or have you ever been a landed immigrant in Canada? A ‘landed immigrant’ (permanent resident) is a person who has been granted the right to live in Canada permanently by immigration authorities.”
Variables such as disability, deafness, and sexual orientation are not available in the dataset and are therefore excluded from the analysis in this report.
50 cultural occupations
Artist occupations
- 5121 Authors and writers
- 5131 Producers, directors, choreographers and related occupations
- 5132 Conductors, composers and arrangers
- 5133 Musicians and singers
- 5134 Dancers
- 5135 Actors and comedians
- 5136 Painters, sculptors and other visual artists
- 5232 Other performers, n.e.c.
- 5244 Artisans and craftspersons
Non-artist cultural occupations related to broadcasting, film and video, sound recording, performing arts and publishing
- 5122 Editors
- 5123 Journalists
- 5222 Film and video camera operators
- 5223 Graphic arts technicians
- 5224 Broadcast technicians
- 5225 Audio and video recording technicians
- 5226 Other technical and co-ordinating occupations in motion pictures, broadcasting and the performing arts
- 5227 Support occupations in motion pictures, broadcasting, photography and the performing arts
- 5231 Announcers and other broadcasters
- 0512 Managers – publishing, motion pictures, broadcasting and performing arts
Cultural occupations related to printing
- 1423 Desktop publishing operators and related occupations
- 7303 Supervisors, printing and related occupations
- 7381 Printing press operators
- 9471 Plateless printing equipment operators
- 9472 Camera, platemaking and other prepress occupations
- 9473 Binding and finishing machine operators
Cultural occupations related to libraries, archives and heritage
- 0511 Library, archive, museum and art gallery managers
- 1253 Records management technicians
- 1451 Library assistants and clerks
- 1452 Correspondence, publication and regulatory clerks
- 5111 Librarians
- 5112 Conservators and curators
- 5113 Archivists
- 5211 Library and public archive technicians
- 5212 Technical occupations related to museums and art galleries
Cultural occupations related to architecture
- 2151 Architects
- 2152 Landscape architects
- 2153 Urban and land use planners
- 2225 Landscape and horticulture technicians and specialists
- 2251 Architectural technologists and technicians
Cultural occupations related to design
- 2175 Web designers and developers
- 2252 Industrial designers
- 2253 Drafting technologists and technicians
- 5241 Graphic designers and illustrators
- 5242 Interior designers and interior decorators
- 5243 Theatre, fashion, exhibit and other creative designers
- 5245 Patternmakers – textile, leather and fur products
Cultural occupations not included elsewhere
- 2224 Conservation and fishery officers
- 1123 Professional occupations in advertising, marketing and public relations
- 5221 Photographers
- 9474 Photographic and film processors
Endnotes
[1] Statistics Canada identified certain people as being from a “visible minority” based on a question about their background. This report refers to these people as “racialized”
[2] The other performers category includes circus performers, magicians, puppeteers, models, and other performers not elsewhere classified.
[3] These statistics are based on “experienced labour force”, which captures those Canadians who had an occupation in May of 2016, or who had worked since January of 2015. Descriptions of the nine arts occupations and a list of the 50 cultural occupations are provided in an appendix.
[4] The other performers category includes circus performers, magicians, puppeteers, models, and other performers not elsewhere classified.
[5] As measured by median incomes.
[6] As measured by median incomes.
[7] Artists who teach in post-secondary, secondary, or elementary schools are excluded from these statistics, because they are classified as professors or teachers rather than in artistic occupations. Instructors and teachers in settings such as private arts schools, academies, and conservatories are included.
[8] Artists who teach in post-secondary, secondary, or elementary schools are excluded from these statistics, because they are classified as professors or teachers rather than in artistic occupations. Instructors and teachers in settings such as private arts schools, academies, and conservatories are included.
[9] In some areas of the arts, producers might be considered arts managers rather than artists per se. However, because it is not possible to separate producers from other workers in this occupation group, the entire occupation group is included in this report.
[10] Artists who teach in post-secondary, secondary, or elementary schools are excluded from these statistics, because they are classified as professors or teachers rather than in artistic occupations. Instructors and teachers in settings such as private arts schools, academies, and conservatories are included.
[11] Artists who teach in post-secondary, secondary, or elementary schools are excluded from these statistics, because they are classified as professors or teachers rather than in artistic occupations. Instructors and teachers in settings such as private arts schools, academies, and conservatories are included.
[12] Artists who teach in post-secondary, secondary, or elementary schools are excluded from these statistics, because they are classified as professors or teachers rather than in artistic occupations. Instructors and teachers in settings such as private arts schools, academies, and conservatories are included.
[13] Artists who teach in post-secondary, secondary, or elementary schools are excluded from these statistics, because they are classified as professors or teachers rather than in artistic occupations. Instructors and teachers in settings such as private arts schools, academies, and conservatories are included.
[14] Artists who teach in post-secondary, secondary, or elementary schools are excluded from these statistics, because they are classified as professors or teachers rather than in artistic occupations. Instructors and teachers in settings such as private arts schools, academies, and conservatories are included.
[15] Artists who teach in post-secondary, secondary, or elementary schools are excluded from these statistics, because they are classified as professors or teachers rather than in artistic occupations. Instructors and teachers in settings such as private arts schools, academies, and conservatories are included.
[16] Artists who teach in post-secondary, secondary, or elementary schools are excluded from these statistics, because they are classified as professors or teachers rather than in artistic occupations. Instructors and teachers in settings such as private arts schools, academies, and conservatories are included.
[17] 25% of households were asked to complete the long-form census, and the weighted response rate was 96.9%. Source: Guide to the Census of Population, 2016, accessed at https://www12.statcan.gc.ca/census-recensement/2016/ref/98-304/index-eng.cfm.
[18] The long-form census questions were accessed at https://www12.statcan.gc.ca/nhs-enm/2016/ref/questionnaires/questions-eng.cfm.

