


Demographic Diversity of Artists in Canada in 2016
SIA report 51

A previous report in the Statistical Insights on the Arts series found that there are 158,100 artists in Canada, representing 0.87% of the overall Canadian labour force (also called the concentration of artists). The median income of Canadian artists is $24,300.
This report, based on data from the 2016 census, focuses on four demographic groups of artists: women, Indigenous people, members of racialized groups, and members of official language minority groups.
Because data related to disability, deafness, and sexual orientation are not available from the census, they could not be analyzed in this report.
Women artists
A higher proportion of Canada’s artists are women (52%) than in the overall labour force (48%). Among women, the concentration of artists (0.94%) is much higher than among men (0.79%).[1]
A higher proportion of women than men artists have a bachelor’s degree or higher (51% vs 42%). Very similar proportions of women and men artists are 45 years of age or older (45% and 47%), Indigenous (3.1% and 3.2%), racialized (15% for both), or immigrants to Canada (21% and 20%). The same proportion of women and men artists are self-employed (52%).
Women and men hold most arts occupations in similar proportions, but there are substantially fewer women producers, directors, and choreographers than men (12% of women artists vs. 23% of men artists) and substantially more women dancers than men (11% vs. 2%).
Figure ES1 provides a comparison of median incomes of different groups of artists. For example, women artists have a median income ($22,300) that is well below that of men artists ($27,100).
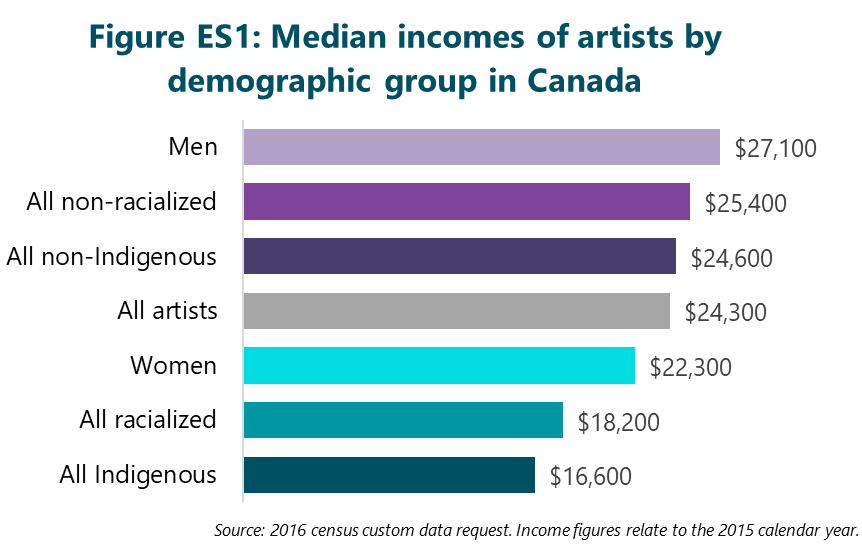
Expressed differently, this means that women artists make 82 cents of total income for every $1 for men artists. In the overall labour force, women make 78 cents of income for every $1 for men. Table ES1 provides relative income totals for the demographic groups that are the focus of this report.
Women artists have lower median incomes than men in six of the nine arts occupations: authors and writers; visual artists; dancers; artisans and craftspeople; other performers; and conductors, composers, and arrangers. Women and men actors and comedians have nearly equal incomes, while women have slightly higher incomes than men in two arts occupations: musicians and singers as well as producers, directors, and choreographers.
The report includes a brief intersectional analysis of women artists’ incomes:
- Indigenous women artists have a median income of $17,800.
- Racialized women artists have a median income of $17,900.
Indigenous artists
The 5,000 Indigenous artists in Canada account for 3.1% of all artists in the country, lower than the proportion of Indigenous workers in the overall labour force (3.9%). The concentration of artists is lower among Indigenous people (0.69%) than non-Indigenous people (0.87%).[2]
| Table ES1: Comparisons of median incomes, 2016 | ||
| Group | Artists (cents on the dollar) | All workers (cents on the dollar) |
| Women (comparison: men) | 82¢ | 78¢ |
| Indigenous (comparison: non-Indigenous) | 68¢ | 85¢ |
| Racialized (comparison: non-racialized) | 72¢ | 78¢ |
| Francophones outside Quebec (comparison: Anglophones outside Quebec) | $1.15 | 99¢ |
| Anglophones in Quebec (comparison: Francophones in Quebec) | 85¢ | 96¢ |
| Source: 2016 census custom data request. Income figures relate to the 2015 calendar year. | ||
Very similar proportions of Indigenous and non-Indigenous artists are women (51% and 52%, respectively). However, fewer Indigenous than non-Indigenous artists are 45 or older (41% vs. 46%) or have a bachelor’s degree or higher (28% vs. 47%).
The most common occupations differ considerably between Indigenous and non-Indigenous artists:
- Much higher proportions of Indigenous than non-Indigenous artists are artisans and visual artists.
- Smaller proportions of Indigenous than non-Indigenous artists are musicians, authors, or producers, directors, and choreographers.
As shown in Figure ES1, Indigenous artists have a median income of $16,600, which is less than one-half of the median income of all Indigenous workers in Canada ($37,200). Non-Indigenous artists have a median income of $24,600, 44% less than all non-Indigenous workers ($43,700).
Indigenous artists make a median income of 68 cents for every $1 for non-Indigenous artists. In the overall labour force, Indigenous workers have a median income of 85 cents for every $1 for non-Indigenous workers.
Indigenous artists have much lower median incomes than non-Indigenous artists in eight of the nine arts occupations. The median incomes of Indigenous artists are less than $14,000 in the two most common occupations: artisans and visual artists.
Racialized artists
There are 23,300 racialized artists in Canada, representing 15% of all artists in the country. This is lower than the proportion of racialized people in the overall labour force (21%). The concentration of artists is lower among racialized people (0.60%) than non-racialized people (0.94%).[3]
A much higher percentage of racialized than non-racialized artists are immigrants (60% vs. 14%). There is a particularly large difference in recent immigration: 42% of racialized artists immigrated to Canada between 1991 and 2016, including 14% who immigrated between 2011 and 2016. In contrast, only 7% of non-racialized artists immigrated to Canada between 1991 and 2016, including 1% who immigrated between 2011 and 2016.
A slightly higher proportion of racialized than non-racialized artists have a bachelor’s degree or higher (50% vs. 46%), but a much smaller proportion are 45 or older (32% vs. 48%). The same proportion of racialized and non-racialized artists are women (52%).
Racialized and non-racialized artists hold many arts occupations in similar proportions.
Figure ES1 shows that racialized artists have a median income of $18,200, about one-half of the median income of all racialized workers in Canada ($35,600). Non-racialized artists have a median income of $25,400, 44% less than all non-racialized workers ($45,700).
Racialized artists make a median income of 72 cents for every $1 for non-racialized artists. In the overall labour force, racialized workers have a median income of 78 cents for every $1 for non-racialized workers.
Racialized artists have lower median incomes than non-racialized artists in eight of the nine arts occupations.
Francophone artists outside Quebec
Based on the language spoken most often at home[4], the 2,000 French-language artists outside Quebec represent 1.2% of all Canadian artists, while French-minority workers outside Quebec represent 1.8% of all Canadian workers.
The concentration of artists is 0.59% for Francophones outside Quebec, compared with 0.93% for Anglophones outside Quebec.
Women represent a higher proportion of Francophone than Anglophone artists outside Quebec (57% vs. 53%). Similarly, a higher proportion of Francophone than Anglophone artists outside Quebec are Indigenous (4.1% vs. 3.6%).
On the other hand, members of racialized groups represent a lower proportion of Francophone than Anglophone artists outside Quebec (10% vs. 13%), as do immigrants (14% vs. 18%).
Francophone artists outside Quebec have a median income of $27,700, 39% less than all Francophone workers outside Quebec. Anglophone artists outside Quebec have a median income of $24,200, 47% less than all Anglophone workers outside Quebec.
Francophone artists outside Quebec have a median income of $1.15 for every $1 for Anglophone artists outside Quebec. In the overall labour force outside Quebec, Francophone workers have a median income that is essentially equal to that of Anglophones (99 cents for every $1).
Francophone and Anglophone artists outside Quebec hold most arts occupations in similar proportions. However, a higher proportion of Francophone than Anglophone artists outside Quebec are producers, directors, and choreographers (25% of Francophone artists vs. 16% of Anglophone artists), but a smaller proportion are authors and writers (13% vs. 19%).
Francophone artists outside Quebec have higher median incomes than Anglophone artists in six of the eight arts occupations with reliable data.
Anglophone artists in Quebec
The 7,300 English-language artists in Quebec represent 4.6% of all Canadian artists, while all English-language workers in Quebec represent just 2.8% of all Canadian workers.
The concentration of artists is 1.40% among Anglophones in Quebec, compared with 0.78% among Francophones in the province.
Similar proportions of Anglophone and Francophone artists in Quebec are women (47% and 48%). However, higher proportions of Anglophone than Francophone artists in Quebec are Indigenous (2.1% vs. 1.6%), racialized (15% vs. 5%), or immigrants to Canada (23% vs. 10%).
Unlike most demographic and geographic groups, the largest arts occupation among Anglophones in Quebec is authors and writers. Musicians and singers (ranked first among most demographic and geographic groups) are the second-largest occupation among Quebec-based Anglophone artists.
A much higher percentage of Anglophone than Francophone artists in Quebec are authors and writers (24% vs. 13%), but a much lower percentage are producers, directors, and choreographers (16% vs. 26%).
Anglophone artists have a median income of $23,700, 42% less than all Anglophone workers in Quebec. Francophone artists have a median income of $27,800, 34% less than all Francophone workers in Quebec.
Anglophone artists in Quebec make a median income of 85 cents for every $1 for Francophone artists in Quebec. In the overall labour force in Quebec, Anglophones have a median income that is close to that of Francophones (96 cents for every $1).
Anglophone artists in Quebec have lower median incomes than Francophone artists in six of the nine arts occupations.
About this report
After an introduction, subsequent sections of the full report provide detailed information about artists in each of the four key demographic groups. Additional data are provided in an appendix. Full methodological notes can be found in the second appendix.
The report is based on a custom data request from the 2016 long-form census, which classifies most people in the occupation in which they worked the most hours during the census reference week (May 1 to 7, 2016).
Some aspects of the census have particular relevance in capturing the working lives of artists:
- Artists who spent more time at another occupation than at their artwork during the reference week would be classified in the other occupation. The census does not capture information about secondary occupations.
- Each occupation includes individuals who are employed or self-employed.
- Artists who teach in post-secondary, secondary, or elementary schools are classified as professors or teachers, not in artistic occupations. Instructors and teachers in some settings (such as private arts schools, academies, and conservatories) are included as “artists”.
Due to major changes in methods between the 2011 National Household Survey and the 2016 census, data in this report are not comparable to previous reports in the Statistical Insights on the Arts series. Reports based on the 2001 and 2006 long-form census are also not comparable, given a change in the base population used in the calculations of artists.[5]
A subsequent report will examine artists in Canadian municipalities.


Using custom data that Hill Strategies requested from Statistics Canada’s 2016 long-form census, this report focuses on four demographic groups of artists: women, Indigenous people, members of racialized groups,[6] and members of official language minority groups.
Because data related to disability, deafness, and sexual orientation are not available from the census, they could not be analyzed in this report.
A previous report in the Statistical Insights on the Arts series found that there are 158,100 artists in Canada, representing 0.87% of the overall Canadian labour force.[7]
Nine detailed occupation codes are included in the count of artists. From largest to smallest in Canada as a whole, the arts occupations are:
- Musicians and singers: 35,000 (22% of all artists)
- Authors and writers: 27,700 (18%)
- Producers, directors, choreographers, and related occupations: 27,600 (17%)
- Visual artists: 21,100 (13%)
- Artisans and craftspeople: 14,700 (9%)
- Actors and comedians: 11,400 (7%)
- Dancers: 10,100 (6%)
- Other performers: 6,300 (4%)[8]
- Conductors, composers, and arrangers: 4,200 (3%)
In order to better understand the situation of artists in each key demographic group, the following factors are examined in the report:
- Number of artists and proportion of all artists in Canada
- Median income[9]
- Number of artists and median income by occupation
- Other characteristics, such as immigration status, age, and education, where available in the custom dataset
The report also provides an intersectional analysis of artists who are in more than one of the key demographic groups (for example, Indigenous women artists). Intersectionality is a concept that “recognizes peoples’ identities and social positions are shaped by multiple factors. Among others, a person’s age, disability, ethnicity, gender identity, religion, sexual orientation, and socioeconomic background contribute towards their unique experiences and perspectives”[10], including the opportunities and challenges that they face as artists.
The following sections of the report provide key information about artists in each demographic group. Additional data are provided in an appendix.
While full methodological notes can be found in Appendix 2, there are a few important elements of census data that should be kept in mind when reading this report:
- The statistics are based on the “experienced labour force”, which captures those Canadians who had an occupation in May of 2016, or who had worked since January of 2015.[11]
- Most people are classified in the occupation in which they worked the most hours during the census reference week (May 1 to 7, 2016).
- Artists who spent more time at another occupation than at their artwork during the reference week would be classified in the other occupation. The census does not capture information about secondary occupations.
- Each occupation includes individuals who are employed or self-employed.
- Artists who teach in post-secondary, secondary, or elementary schools are classified as professors or teachers, not in artistic occupations. Instructors and teachers in some settings (such as private arts schools, academies, and conservatories) are included as “artists”.
- Due to major changes in methods between the 2011 National Household Survey and the 2016 census, data in this report are not comparable to previous reports in the Statistical Insights on the Arts Reports based on the 2001 and 2006 long-form census are also not comparable, given a change in the base population used in the calculations of artists.[12]
A subsequent report will examine artists in Canadian municipalities.


Of the 158,100 artists in Canada, 82,500 are women. A higher proportion of artists are women (52%) than the overall labour force (48%). Among women, the concentration of artists (0.94%) is much higher than among men (0.79%).[13]
As shown in Table 1, a higher proportion of women than men artists have a bachelor’s degree or higher (51% vs 42%). Among both women and men, much higher proportions of artists than all workers have at least a bachelor’s degree.
Very similar proportions of women and men artists (45% and 47%) are 45 years of age or older. These percentages are similar to those for all women and men in the labour force.
The same proportion of women and men artists (52%) are self-employed. Both of these percentages are many times higher than those for all women and men in the labour force.
Very similar proportions of women and men artists are Indigenous, racialized, or immigrants to Canada:[14]
- Indigenous: 3.1% of women artists and 3.2% of men artists
- Racialized: 15% of both women and men artists
- Immigrants: 21% of women artists and 20% of men artists
| Table 1: Education, age, and self-employment of women and men artists | ||
| Statistic | Women | Men |
| Bachelor’s degree or higher | ||
| Artists | 51% | 42% |
| All workers | 31% | 25% |
| 45 or older | ||
| Artists | 45% | 47% |
| All workers | 44% | 45% |
| Self-employed | ||
| Artists | 52% | 52% |
| All workers | 9% | 14% |
| Source: 2016 census custom data request. | ||
Incomes of women artists
Figure 1 compares the median incomes of women and men artists and all workers. Women artists have a median income of $22,300, 42% less than all women in the labour force. Men artists have a median income of $27,100, 45% less than all men in the labour force.
Expressed as cents on the dollar, women artists make 82 cents of total income for every $1 for men artists. In the overall labour force, women have a median income of 78 cents for every $1 for men.

Employment and household income statistics for women and men artists follow:
- Women artists have a median employment income of $14,600, representing 69 cents for every $1 earned by men artists (median of $21,100).
- Women artists have a median household income of $52,300, representing 84 cents for every $1 of household income for men artists (median of $62,200).
Incomes of different groups of women artists
As noted above, the median income of all women artists is $22,300. As indicated in Table 2, Indigenous and racialized women artists have particularly low median incomes.
| Table 2: Median incomes of different groups of women and men artists | ||
| Group | Women artists | Men artists |
| Indigenous | $17,800 | $15,700 |
| Non-Indigenous | $22,500 | $27,500 |
| Racialized | $17,900 | $18,800 |
| Non-racialized | $23,100 | $28,800 |
| Immigrants | $20,800 | $23,400 |
| Non-immigrants | $22,900 | $28,200 |
| Bachelor’s degree or higher[15] | $27,300 | $32,700 |
| Source: 2016 census custom data request. Income figures relate to the 2015 calendar year. | ||
Women artists by occupation and industry
While women and men hold most arts occupations in similar proportions, there are substantially fewer women producers, directors, and choreographers than men (12% of women artists vs. 23% of men artists)[16] and substantially more women dancers than men (11% vs. 2%). Table 3 provides the percentages for all nine arts occupations.
| Table 3: Women and men artists by occupation | ||
| Occupation | % of women artists | % of men artists |
| Musicians & singers | 22% | 22% |
| Authors & writers | 19% | 16% |
| Visual artists | 14% | 12% |
| Producers, directors, choreographers & related occupations | 12% | 23% |
| Dancers | 11% | 2% |
| Artisans & craftspeople | 11% | 8% |
| Actors & comedians | 6% | 8% |
| Other performers | 4% | 4% |
| Conductors, composers & arrangers | 2% | 4% |
| Source: 2016 census custom data request | ||
These differences have implications for median incomes, because producers, directors, and choreographers are the arts occupation with the highest median income, while dancers are the arts occupation with the lowest median income.
There are substantial differences in the proportion of women and men artists in three key industries that employ the vast majority of Canada’s artists:
- Arts, entertainment, and recreation: 31% of women artists and 38% of men artists
- Educational services: 28% of women artists and 11% of men artists
- Information and cultural industries[17]: 14% of women artists and 25% of men artists
Table 4 shows that women artists have lower median incomes than men in six of the nine arts occupations: authors and writers; visual artists; dancers; artisans and craftspeople; other performers; and conductors, composers, and arrangers. Women and men actors and comedians have nearly equal incomes, while women have slightly higher incomes than men in two arts occupations: musicians and singers as well as producers, directors, and choreographers.
| Table 4: Median income by arts occupation for women and men | |||
| Occupation | Women artists | Men artists | Cents on the dollar |
| Musicians & singers | $18,500 | $17,300 | $1.07 |
| Authors & writers | $37,300 | $44,300 | 84¢ |
| Visual artists | $17,500 | $24,000 | 73¢ |
| Producers, directors, choreographers & related | $51,500 | $48,500 | $1.06 |
| Dancers | $15,500 | $18,200 | 85¢ |
| Artisans & craftspeople | $19,300 | $22,900 | 84¢ |
| Actors & comedians | $18,400 | $18,600 | 99¢ |
| Other performers | $14,800 | $19,600 | 75¢ |
| Conductors, composers & arrangers | $28,400 | $31,000 | 92¢ |
| All artists | $22,300 | $27,100 | 82¢ |
| Source: 2016 census custom data request. Income figures relate to the 2015 calendar year. | |||

The 5,000 Indigenous artists in Canada account for 3.1% of the 158,100 artists in the country. This proportion is lower than the proportion of Indigenous workers in the overall labour force (3.9%). The concentration of artists is lower among Indigenous people (0.69%) than non-Indigenous people (0.87%).[18]
Very similar proportions of Indigenous and non-Indigenous artists are women. However, fewer Indigenous than non-Indigenous artists are 45 or older or have a bachelor’s degree or higher:
- Women: 51% of Indigenous artists and 52% of non-Indigenous artists
- 45 or older: 41% of Indigenous artists and 46% of non-Indigenous artists
- Bachelor’s degree or higher: 28% of Indigenous artists and 47% of non-Indigenous artists
The proportion of Indigenous artists who are immigrants to Canada is very low (2.8%). By definition, Indigenous people are not considered racialized.[19]
Incomes of Indigenous artists
As shown in Figure 2, Indigenous artists have a median income of $16,600, less than one-half of the median income of all Indigenous workers in Canada ($37,200). Non-Indigenous artists have a median income of $24,600, 44% less than all non-Indigenous workers ($43,700).
Indigenous artists make a median income of 68 cents for every $1 for non-Indigenous artists. In the overall labour force, Indigenous workers have a median income of 85 cents for every $1 for non-Indigenous workers.

Employment and household income statistics for Indigenous and non-Indigenous artists follow:
- Indigenous artists earn a median employment income of $13,300, representing 76 cents for every $1 earned by non-Indigenous artists (median of $17,500).
- Indigenous artists have a median household income of $43,000, representing 74 cents for every $1 of household income for non-Indigenous artists (median of $58,300).
Incomes of different groups of Indigenous artists
Table 5 shows that Indigenous men have particularly low median incomes ($15,700), below the median income of all Indigenous artists ($16,600). The gap between Indigenous and non-Indigenous artists is lower for artists with a bachelor’s degree or higher.
| Table 5: Median incomes of different groups of Indigenous artists | ||
| Group | Indigenous artists | Non-Indigenous artists |
| Women | $17,800 | $22,500 |
| Men | $15,700 | $27,500 |
| Bachelor’s degree or higher | $26,100 | $29,400 |
| Source: 2016 census custom data request. Income figures relate to the 2015 calendar year. | ||
Indigenous artists by occupation
The most common occupations differ considerably between Indigenous and non-Indigenous artists, as shown in Table 6. Much higher proportions of Indigenous than non-Indigenous artists are artisans and visual artists. On the other hand, much lower percentages of Indigenous than non-Indigenous artists are musicians, authors, or producers, directors, and choreographers (a list that includes the two highest-income arts occupations: authors and producers, directors, and choreographers).
| Table 6: Indigenous and non-Indigenous artists by occupation | ||
| Occupation | % of Indigenous artists | % of non-Indigenous artists |
| Artisans & craftspeople | 21% | 9% |
| Visual artists | 17% | 13% |
| Musicians & singers | 13% | 22% |
| Authors & writers | 13% | 18% |
| Producers, directors, choreographers & related occupations | 13% | 18% |
| Actors & comedians | 9% | 7% |
| Dancers | 7% | 6% |
| Other performers | 5% | 4% |
| Conductors, composers & arrangers | 2% | 3% |
| Source: 2016 census custom data request | ||
Table 7 shows that Indigenous artists have much lower median incomes than non-Indigenous artists in eight of the nine arts occupations. The median incomes of Indigenous artists are below $14,000 in the two most common occupations: artisans and visual artists.
| Table 7: Median income by occupation for Indigenous and non-Indigenous artists | |||
| Occupation | Indigenous artists | Non-Indigenous artists | Cents on the dollar |
| Artisans & craftspeople | $13,800 | $21,100 | 65¢ |
| Visual artists | $13,500 | $20,300 | 67¢ |
| Musicians & singers | $15,300 | $17,900 | 85¢ |
| Authors & writers | $26,900 | $40,300 | 67¢ |
| Producers, directors, choreographers & related | $38,700 | $49,500 | 78¢ |
| Actors & comedians | $13,300 | $18,800 | 70¢ |
| Dancers | $12,000 | $15,900 | 75¢ |
| Other performers | $13,800 | $17,100 | 81¢ |
| Conductors, composers & arrangers | $34,000 | $29,600 | $1.15 |
| All artists | $16,600 | $24,600 | 68¢ |
| Source: 2016 census custom data request. Income figures relate to the 2015 calendar year. | |||
There are 23,300 racialized artists in Canada, representing 15% of the 158,100 artists in the country. This is lower than the proportion of racialized people in the overall labour force (21%). The concentration of artists is lower among racialized people (0.60%) than non-racialized people (0.94%).[20]
A much higher percentage of racialized than non-racialized artists are immigrants (60% vs. 14%). There is a particularly large difference in recent immigration: 42% of racialized artists immigrated to Canada between 1991 and 2016, including 14% who immigrated between 2011 and 2016. In contrast, only 7% of non-racialized artists immigrated to Canada between 1991 and 2016, including 1% who immigrated between 2011 and 2016.
A slightly higher proportion of racialized than non-racialized artists have a bachelor’s degree or higher (50% vs. 46%), but a much smaller proportion are 45 or older (32% vs. 48%).
The same proportion of racialized and non-racialized artists are women (52%). By definition, Indigenous people are not considered racialized unless they identify as both.
Incomes of racialized artists
As presented in Figure 3, racialized artists have a median income of $18,200, about one-half of the median income of all racialized workers in Canada ($35,600). Non-racialized artists have a median income of $25,400, 44% less than all non-racialized workers ($45,700).

Racialized artists make a median income of 72 cents for every $1 for non-racialized artists. In the overall labour force, racialized workers have a median income of 78 cents for every $1 for non-racialized workers.
Regarding employment and household incomes:
- Racialized artists have a median employment income of $15,000, representing 85 cents for every $1 earned by non-racialized artists (median of $17,800).
- Racialized artists have a median household income of $47,000, representing 80 cents for every $1 of household income for non-racialized artists (median of $59,100).
Incomes of different groups of racialized artists
As noted above, the median income of all racialized artists is $18,200. Table 8 shows that many groups of racialized artists have low median incomes. Differences between racialized and non-racialized artists are substantial for each group.
| Table 8: Median incomes of different groups of racialized artists | ||
| Group | Racialized artists | Non-racialized artists |
| Women | $17,900 | $23,100 |
| Men | $18,800 | $28,800 |
| Immigrants | $19,300 | $28,000 |
| Non-immigrants | $24,000 | $32,400 |
| Bachelor’s degree or higher | $20,700 | $31,300 |
| Source: 2016 census custom data request. Income figures relate to the 2015 calendar year. | ||
Racialized artists by occupation
Racialized and non-racialized artists hold many arts occupations in similar proportions. The small differences between the two groups are shown in Table 9.
| Table 9: Racialized and non-racialized artists by occupation | ||
| Occupation | % of racialized artists | % of non-racialized artists |
| Musicians & singers | 25% | 22% |
| Authors & writers | 15% | 18% |
| Producers, directors, choreographers & related occupations | 15% | 18% |
| Visual artists | 14% | 13% |
| Actors & comedians | 9% | 7% |
| Artisans & craftspeople | 9% | 9% |
| Dancers | 6% | 6% |
| Other performers | 5% | 4% |
| Conductors, composers & arrangers | 2% | 3% |
| Source: 2016 census custom data request | ||
Table 10 shows that racialized artists have lower median incomes than non-racialized artists in eight of the nine arts occupations. The one exception: racialized artisans have somewhat higher incomes than non-racialized artisans.
| Table 10: Median income by arts occupation for racialized and non-racialized people | |||
| Occupation | Racialized artists | Non-racialized artists | Cents on the dollar |
| Musicians & singers | $14,300 | $18,700 | 76¢ |
| Authors & writers | $31,000 | $41,300 | 75¢ |
| Producers, directors, choreographers & related | $32,300 | $51,700 | 63¢ |
| Visual artists | $17,400 | $20,400 | 86¢ |
| Actors & comedians | $13,600 | $19,600 | 69¢ |
| Artisans & craftspeople | $22,600 | $20,400 | $1.11 |
| Dancers | $13,500 | $16,200 | 83¢ |
| Other performers | $16,100 | $17,000 | 95¢ |
| Conductors, composers & arrangers | $19,500 | $31,300 | 62¢ |
| All artists | $18,200 | $25,400 | 72¢ |
| Source: 2016 census custom data request. Income figures relate to the 2015 calendar year. | |||

Of the 158,100 artists in Canada, 9,300 are members of official language minority communities (based on the language spoken most often at home).[21] Official language minority Canadians represent a higher proportion of artists (5.9%) than all workers (4.7%). The rest of this section examines separately the two official language minority communities: Francophones outside Quebec and Anglophones in Quebec.[22]
Francophone artists outside Quebec
The 2,000 French-language artists outside Quebec represent 1.2% of all Canadian artists, while French-minority workers outside Quebec represent 1.8% of all Canadian workers.
The concentration of artists is 0.59% for Francophones outside Quebec, compared with 0.93% for Anglophones outside Quebec.
Women and Indigenous people represent a higher proportion of Francophone than Anglophone artists outside Quebec. On the other hand, members of racialized groups and immigrants represent a lower proportion of Francophone than Anglophone artists outside Quebec:
- Women represent 57% of Francophone artists outside Quebec and 53% of Anglophone artists outside Quebec.
- Indigenous people account for 4.1% of Francophone artists outside Quebec and 3.6% of Anglophone artists outside Quebec.
- Members of racialized groups represent 10% of Francophone artists outside Quebec and 13% of Anglophone artists outside Quebec.
- Immigrants account for 14% of Francophone artists outside Quebec and 18% of Anglophone artists outside Quebec.
Incomes of Francophone artists outside Quebec
Figure 4 compares the median incomes of Francophones and Anglophones outside Quebec (for both artists and all workers). Francophone artists outside Quebec have a median income of $27,700, 39% less than all Francophone workers outside Quebec. Anglophone artists outside Quebec have a median income of $24,200, 47% less than all Anglophone workers outside Quebec.
Francophone artists outside Quebec have a median income of $1.15 for every $1 for Anglophone artists outside Quebec. In the overall labour force outside Quebec, Francophone workers have a median income that is essentially equal to that of Anglophones (99 cents for every $1).

Employment and household income statistics for artists outside Quebec follow:
- Francophone artists have a median employment income of $17,500, representing $1.02 for every $1 earned by Anglophone artists (median of $17,200).
- Francophone artists have a median household income of $67,300, representing $1.11 for every $1 of household income for Anglophone artists (median of $60,400).
Incomes of different groups of Francophone artists outside Quebec
As shown in Table 11, among Francophones outside Quebec, Indigenous, racialized, women, and immigrant artists have median incomes below the median of all Francophone artists outside Quebec ($27,700).
| Table 11: Median incomes of different groups of artists outside Quebec | ||
| Group | Francophone artists | Anglophone artists |
| Women | $24,200 | $22,100 |
| Men | $33,000 | $27,600 |
| Indigenous | $16,200 | $16,300 |
| Non-Indigenous | $28,700 | $24,600 |
| Racialized | $23,100 | $19,300 |
| Non-racialized | $28,200 | $25,400 |
| Immigrants | $25,900 | $23,900 |
| Non-immigrants | $28,700 | $24,200 |
| Source: 2016 census custom data request. Income figures relate to the 2015 calendar year. | ||
Francophone artists outside Quebec by occupation
Francophone and Anglophone artists outside Quebec hold most arts occupations in similar proportions. However, a higher proportion of Francophone than Anglophone artists outside Quebec are producers, directors, and choreographers (25% vs. 16%)[23], but a lower proportion are authors and writers (13% of Francophone artists vs. 19% of Anglophone artists). These are the two arts occupation groups with the highest median incomes, and the differences may have conflicting implications for median incomes. Table 12 provides the percentages for all nine arts occupations.
| Table 12: Francophone and Anglophone artists outside Quebec by occupation | ||
| Occupation | % of Francophone artists | % of Anglophone artists |
| Producers, directors, choreographers & related occupations | 25% | 16% |
| Musicians & singers | 21% | 22% |
| Authors & writers | 13% | 19% |
| Visual artists | 12% | 13% |
| Artisans & craftspeople | 9% | 9% |
| Dancers | 9% | 7% |
| Actors & comedians | 7% | 8% |
| Other performers | 3% | 4% |
| Conductors, composers & arrangers | not reliable | 2% |
| Source: 2016 census custom data request. | ||
As indicated in Table 13, Francophone artists outside Quebec have higher median incomes than Anglophone artists in six of the eight arts occupations with reliable data. The exceptions are artisans and craftspeople (with Francophone artisans making 92 cents for every $1 of income by Anglophone artisans) and other performers (very little difference).
| Table 13: Median income by occupation for Francophone and Anglophone artists outside Quebec | |||
| Occupation | Francophone artists | Anglophone artists | Cents on the dollar |
| Producers, directors, choreographers & related | $59,000 | $50,600 | $1.17 |
| Musicians & singers | $19,600 | $18,100 | $1.08 |
| Authors & writers | $46,200 | $40,000 | $1.15 |
| Visual artists | $22,200 | $19,600 | $1.13 |
| Artisans & craftspeople | $19,200 | $20,900 | 92¢ |
| Dancers | $17,900 | $16,200 | $1.11 |
| Actors & comedians | $24,900 | $17,200 | $1.45 |
| Other performers | $16,600 | $16,300 | $1.02 |
| Conductors, composers & arrangers | not reliable | $32,700 | n/a |
| All artists | $27,700 | $24,200 | $1.15 |
| Source: 2016 census custom data request. Income figures relate to the 2015 calendar year. | |||
Anglophone artists in Quebec
The 7,300 English-language artists in Quebec represent 4.6% of all Canadian artists, while all English-language workers in Quebec represent just 2.8% of all Canadian workers.
The concentration of artists is 1.40% among Anglophones in Quebec, compared with 0.78% among Francophones in the province.
Similar percentages of Anglophone and Francophone artists in Quebec are women. Higher proportions of Anglophone than Francophone artists in Quebec are Indigenous, racialized, or immigrants to Canada:
- Women represent 47% of Anglophone artists in Quebec and 48% of Francophone artists in the province.
- Indigenous people account for 2.1% of Anglophone artists in Quebec and 1.6% of Francophone artists in the province.
- Members of racialized groups represent 15% of Anglophone artists in Quebec and 5% of Francophone artists in the province.
- Immigrants to Canada account for 23% of Anglophone artists in Quebec and 10% of Francophone artists in the province.
Income of Anglophone artists in Quebec
Figure 5 compares the median incomes of Anglophones and Francophones in Quebec (for both artists and all workers). Anglophone artists have a median income of $23,700, 42% less than all Anglophone workers in Quebec. Francophone artists have a median income of $27,800, 34% less than all Francophone workers in Quebec.
Anglophone artists in Quebec make a median income of 85 cents for every $1 for Francophone artists in Quebec. In the overall labour force in Quebec, Anglophones have a median income that is close to that of Francophones (96 cents for every $1).

Regarding employment and household incomes:
- Anglophone artists have a median employment income of $16,800, or 85 cents for every $1 earned by Francophone artists (median of $19,800).
- Anglophone artists have a median household income of $45,600, representing 83 cents for every $1 of household income for Francophone artists (median of $55,100).
Incomes of different groups of Anglophone artists in Quebec
As noted above, the median of all Anglophone artists in Quebec is $23,700. Table 14 shows that Indigenous Anglophone artists in Quebec have very low median incomes. In addition, racialized artists in Quebec have particularly low median incomes regardless of language.
| Table 14: Median incomes of different groups of artists in Quebec | ||
| Group | Anglophone artists | Francophone artists |
| Women | $23,200 | $26,400 |
| Men | $24,400 | $29,700 |
| Indigenous | $12,600 | $24,700 |
| Non-Indigenous | $24,200 | $27,900 |
| Racialized | $18,500 | $17,700 |
| Non-racialized | $24,700 | $28,200 |
| Immigrants | $23,100 | $26,500 |
| Non-immigrants | $23,800 | $28,000 |
| Source: 2016 census custom data request. Income figures relate to the 2015 calendar year. | ||
Anglophone artists in Quebec by occupation
Unlike most demographic and geographic groups, the largest arts occupation among Anglophones in Quebec is authors and writers. Musicians and singers, the largest arts occupation for most demographic and geographic groups, are the second-largest occupation among Quebec-based Anglophone artists.
A much higher proportion of Anglophone artists in Quebec than their Francophone counterparts are authors and writers (24% vs. 13%). A much lower percentage of Anglophone than Francophone artists in Quebec are producers, directors, and choreographers (16% vs. 26%). These differences may have conflicting implications for median incomes, because they are the two arts occupation groups with the highest median incomes.
Similar proportions of Anglophone and Francophone artists in Quebec hold the other arts occupations. Table 15 provides the percentages for all nine arts occupations.
| Table 15: Anglophone and Francophone artists in Quebec by occupation | ||
| Occupation | % of Anglophone artists | % of Francophone artists |
| Authors & writers | 24% | 13% |
| Musicians & singers | 21% | 19% |
| Producers, directors, choreographers & related occupations | 16% | 26% |
| Visual artists | 13% | 15% |
| Artisans & craftspeople | 6% | 8% |
| Dancers | 6% | 6% |
| Actors & comedians | 5% | 7% |
| Other performers | 5% | 4% |
| Conductors, composers & arrangers | 3% | 3% |
| Source: 2016 census custom data request. | ||
As shown in Table 16, Anglophone artists in Quebec have lower median incomes than Francophone artists in six of the nine arts occupations. The exceptions are musicians and singers (very little difference), dancers (with Anglophone dancers making $1.24 for every $1 for Francophone dancers), and conductors, composers, and arrangers (with Anglophones making $1.06 for every $1 for Francophones).
| Table 16: Median income by occupation for Anglophone and Francophone artists in Quebec | |||
| Occupation | Anglophone artists | Francophone artists | Cents on the dollar |
| Authors & writers | $41,700 | $43,900 | 95¢ |
| Musicians & singers | $17,900 | $18,300 | 98¢ |
| Producers, directors, choreographers & related | $40,500 | $52,300 | 77¢ |
| Visual artists | $18,300 | $22,500 | 81¢ |
| Artisans & craftspeople | $19,200 | $20,500 | 94¢ |
| Dancers | $18,500 | $14,900 | $1.24 |
| Actors & comedians | $19,900 | $26,900 | 74¢ |
| Other performers | $16,000 | $18,400 | 87¢ |
| Conductors, composers & arrangers | $26,600 | $25,200 | $1.06 |
| All artists | $23,700 | $27,800 | 85¢ |
| Source: 2016 census custom data request. Income figures relate to the 2015 calendar year. | |||

The detailed tables are available here in MS-Excel format.


Because of major methodological changes between the 2011 National Household Survey and the 2016 long-form census, data in this report are not comparable to data in previous reports in the Statistical Insights on the Arts series. The National Household Survey was voluntary, while the long-form census is mandatory. The census was completed by 25% of all Canadian households.
Compared with even older reports in the Statistical Insights on the Arts series (using 2001 and 2006 long-form census data), there has been a change in the base population analyzed for this report. This report examines the experienced labour force, which includes all those who worked as an artist during the census reference week or worked as an artist longer than any other position since January 1, 2015. Reports from 2006 excluded respondents with no income, while this report places no restriction on incomes.
There are other important aspects about the classification of artists in census data:
- Canadians 15 or older are classified in the occupation in which they worked the most hours during the census reference week (May 1 to 7, 2016). If they were unemployed during that week, they are classified based on the job at which they worked the longest since January 1, 2015. If they did not work at all during that period, or if they were not in the labour force during the reference week, they are excluded from the experienced labour force (and the statistics in this report).
- Artists who spent more time at another occupation than at their artwork during the reference week would be categorized in the other occupation. The census does not capture information about secondary occupations.
- Each occupation includes individuals who are employed or self-employed.
- Artists who teach in post-secondary, secondary, or elementary schools are classified as professors or teachers, not in artistic occupations. Instructors and teachers in some settings (such as private arts schools, academies, and conservatories) are included as “artists”.
- The 2016 census collected income information for 2015, the most recent calendar year.
- Total incomes include wages and salaries, net self-employment income, investment income, retirement pensions, other income sources (a category that includes artists’ project grants), as well as government transfer payments.
- Employment income statistics include amounts received from all employment and self-employment positions in 2015, not just the position at which the respondent worked the most hours during the reference week. In some cases, individuals may have worked in a different occupation in 2015 (the basis for earnings statistics) than the one in which they worked the most hours during the census reference week (May 1 to 7, 2016 – the basis for occupational classifications). In these cases, the earnings would have been based on the other occupation.
- The report highlights artists’ situations in the three most common sectors for artists: 1) arts, entertainment, and recreation; 2) educational services; and 3) information and cultural industries.
- Because of major changes in methods between the 2011 National Household Survey and the 2016 census, data in this report are not comparable to previous reports. Subsequent reports will examine artists in the provinces and local areas, as well as demographic differences in the situations of artists.
Choice of nine arts occupations
In this report, the term “artists” is used to describe those Canadians 15 or older classified into nine occupation groups:
- Actors and comedians
- Artisans and craftspersons
- Authors and writers
- Conductors, composers and arrangers
- Dancers
- Musicians and singers
- Other performers (including circus performers, magicians, models, puppeteers, and other performers not elsewhere classified)
- Producers, directors, choreographers, and related occupations
- Visual artists (categorized by Statistics Canada as “painters, sculptors and other visual artists”)
These occupation groups were identified as artistic in discussions by arts sector representatives prior to the analysis of the 2001 census. These nine occupation groups were selected for inclusion in the Statistical Insights on the Arts series during discussions between Hill Strategies Research and the project funders: the Canada Council for the Arts, the Ontario Arts Council, and the Department of Canadian Heritage.
In general, the nine occupations were selected as “artists” on the basis of the artistic nature of the occupations, based on occupation titles and descriptions.
Strengths and limitations of census data for counting artists
The 2016 long-form census is one of the best available sources of information on artists in Canada. The census provides occupation estimates based on a very large population base: the 3.7 million households that completed the long-form version of the census.[24] This allows for a fine-grained analysis of the situations of artists in many jurisdictions across the country.
However, there are strong limitations to census data on artists, related to the focus on the job where an individual worked the most hours, the timing of the census, and the nature of the standard occupational classifications.
The focus on the job where the individual worked the most hours affects census labour force counts. Having multiple jobs is an important facet of the working life of many artists. Some may work more hours at other jobs during the week than at their art. Due to this, census-based estimates of artists are likely to be somewhat low.
A gap in the Statistics Canada occupational classification is the fact that there is no distinct category for filmmakers or other media artists. The closest categories are “Producers, directors, choreographers, and related occupations” (which includes a number of artforms), “film and video camera operators” (not one of the nine arts occupations), and “painters, sculptors, and other visual artists”.
Another example of an occupation group that is not a perfect fit for artists is the authors and writers category. This occupation group includes a broader range of writers than simply novelists, poets and other “artistic” writers (but excludes journalists).
Another issue is the timing of the census. The classification of occupations is based on the job that respondents spend the most hours at during the week of Sunday, May 1 to Saturday, May 7, 2016. This is an “in between” period for many artistic endeavors. For example, many performing arts organizations have seasons that extend from the fall to the spring. These seasons may be finished before the week of May 1, leaving some artists to find other employment during the late spring and summer. Other organizations may have summer seasons that do not begin in early May.
Nine arts occupations and 50 cultural occupations
Artist occupations (also included as cultural occupations)
- 5121 Authors and writers
- 5131 Producers, directors, choreographers and related occupations
- 5132 Conductors, composers and arrangers
- 5133 Musicians and singers
- 5134 Dancers
- 5135 Actors and comedians
- 5136 Painters, sculptors and other visual artists
- 5232 Other performers, n.e.c.
- 5244 Artisans and craftspersons
Non-artist cultural occupations related to broadcasting, film and video, sound recording, performing arts and publishing
- 5122 Editors
- 5123 Journalists
- 5222 Film and video camera operators
- 5223 Graphic arts technicians
- 5224 Broadcast technicians
- 5225 Audio and video recording technicians
- 5226 Other technical and coordinating occupations in motion pictures, broadcasting and the performing arts
- 5227 Support occupations in motion pictures, broadcasting, photography and the performing arts
- 5231 Announcers and other broadcasters
- 0512 Managers – publishing, motion pictures, broadcasting and performing arts
Cultural occupations related to printing
- 1423 Desktop publishing operators and related occupations
- 7303 Supervisors, printing and related occupations
- 7381 Printing press operators
- 9471 Plateless printing equipment operators
- 9472 Camera, platemaking and other prepress occupations
- 9473 Binding and finishing machine operators
Cultural occupations related to libraries, archives and heritage
- 0511 Library, archive, museum and art gallery managers
- 1253 Records management technicians
- 1451 Library assistants and clerks
- 1452 Correspondence, publication and regulatory clerks
- 5111 Librarians
- 5112 Conservators and curators
- 5113 Archivists
- 5211 Library and public archive technicians
- 5212 Technical occupations related to museums and art galleries
Cultural occupations related to architecture
- 2151 Architects
- 2152 Landscape architects
- 2153 Urban and land use planners
- 2225 Landscape and horticulture technicians and specialists
- 2251 Architectural technologists and technicians
Cultural occupations related to design
- 2175 Web designers and developers
- 2252 Industrial designers
- 2253 Drafting technologists and technicians
- 5241 Graphic designers and illustrators
- 5242 Interior designers and interior decorators
- 5243 Theatre, fashion, exhibit and other creative designers
- 5245 Patternmakers – textile, leather and fur products
Cultural occupations not included elsewhere
- 2224 Conservation and fishery officers
- 1123 Professional occupations in advertising, marketing and public relations
- 5221 Photographers
- 9474 Photographic and film processors
Endnotes
[1] The 2016 census included a “binary” question regarding sex, with just two response options: “What is this person’s sex? Male; Female”. Because the terms female and male often refer to biological sex characteristics, this report uses the more inclusive terms women and men (which often refer to gender rather than sex).
[2] The 2016 census asked: “Is this person an Aboriginal person, that is, First Nations (North American Indian), Métis or Inuk (Inuit)?” Respondents who said yes are referred to as Indigenous in this report.
[3] Statistics Canada identified respondents as being from a “visible minority”, referred to as “racialized” in this report, based on a question about respondents’ backgrounds: “Is this person: Mark more than one circle or specify, if applicable.; White; South Asian (e.g., East Indian, Pakistani, Sri Lankan, etc.); Chinese; Black; Filipino; Latin American; Arab; Southeast Asian (e.g., Vietnamese, Cambodian, Laotian, Thai, etc.); West Asian (e.g., Iranian, Afghan, etc.); Korean; Japanese; Other — specify”.
[4] The census question is: “What language does this person speak most often at home? English; French; Other language — specify”. People could select multiple languages if they were used equally often. For the custom dataset, these multiple selections were counted in each of the language groups. In other words, the combination of English + French + other is more than 100% in the dataset.
[5] Reports from 2001 and 2006 excluded respondents with no income, while this report places no restriction on incomes.
[6] Statistics Canada identified respondents as being from a “visible minority” based on a question about their background. This report uses the term “racialized” to refer to visible minority respondents.
[7] A Statistical Profile of Artists in Canada in 2016, available at https://hillstrategies.com/resource/statistical-profile-of-artists-in-canada-in-2016/.
[8] The other performers category includes circus performers, magicians, puppeteers, models, and other performers not elsewhere classified.
[9] The analysis in the report focuses on median incomes, which are believed to provide a better indication of the typical situation of artists than the average (i.e., the “mean”), which is more strongly affected by a few individuals with very high incomes.
[10] Christoffersen, A., (2016). ““Intersectional approaches to equality research and data: Research and data briefing” Equality Challenge Unit. Retrieved from: http://www.ecu.ac.uk/wp-content/uploads/2017/04/Research_and_data_briefing_2_Intersectional_approaches_to_equality_research_and_data.pdf
[11] To ensure data reliability and accuracy, no estimates of fewer than 40 artists are provided in this report.
[12] Reports from 2001 and 2006 excluded respondents with no income, while this report places no restriction on incomes.
[13] The 2016 census included a “binary” question regarding sex, with just two response options: “What is this person’s sex? Male; Female”. Because the terms female and male often refer to biological sex characteristics, this report uses the more inclusive terms women and men (which often refer to gender rather than sex). In preparation for the 2021 census, Statistics Canada is testing questions related to sex at birth and gender.
[14] Statistics for women who are members of an official language minority group are covered in the section on official language minority artists.
[15] Median incomes increase by education level for both women and men. However, median incomes are only available for detailed educational levels, not for all women or men artists with less than a bachelor’s degree.
[16] Most producers, directors, and choreographers work in the cultural industries. This occupation group “includes people who oversee and control the technical and artistic aspects of film, television, video game, radio, dance and theatre productions.” (National Occupational Classification, 2016)
[17] The information and cultural industries grouping includes publishing, motion pictures, sound recording, broadcasting, and other industries.
[18] The 2016 census asked: “Is this person an Aboriginal person, that is, First Nations (North American Indian), Métis or Inuk (Inuit)?” Respondents who said yes are referred to as Indigenous in this report.
[19] A small number of people identified as both Indigenous and racialized (visible minority) in the census and would be counted in both groups.
[20] Statistics Canada identified respondents as being from a “visible minority”, referred to as “racialized” in this report, based on a question about respondents’ backgrounds: “Is this person: Mark more than one circle or specify, if applicable.; White; South Asian (e.g., East Indian, Pakistani, Sri Lankan, etc.); Chinese; Black; Filipino; Latin American; Arab; Southeast Asian (e.g., Vietnamese, Cambodian, Laotian, Thai, etc.); West Asian (e.g., Iranian, Afghan, etc.); Korean; Japanese; Other — specify”.
[21] The census question is: “What language does this person speak most often at home? English; French; Other language — specify”. People could select multiple languages if they were used equally often. For the custom dataset, these multiple selections were counted in each of the language groups. In other words, the combination of English + French + other is more than 100% in the dataset.
[22] Because of the limitations of the census data request, only certain demographic characteristics are available for each official language minority group.
[23] Most producers, directors, and choreographers work in the cultural industries. This occupation group “includes people who oversee and control the technical and artistic aspects of film, television, video game, radio, dance and theatre productions.” (National Occupational Classification, 2016)
[24] 25% of households were asked to complete the long-form census, and the weighted response rate was 96.9%. Source: Guide to the Census of Population, 2016, accessed at https://www12.statcan.gc.ca/census-recensement/2016/ref/98-304/index-eng.cfm.


