


The Arts and Individual Well-Being in Canada
Connections between Cultural Activities and Health, Volunteering, Satisfaction with Life, and Other Social Indicators in 2010
Executive Summary
The Arts and Individual Well-Being in Canada, the 39th report in the Statistical Insights on the Arts series, examines whether connections exist between Canadians' cultural activities and their personal well-being.
The data in the report show that there is a strong connection between 18 cultural activities and eight indicators of health and well-being (such as health, mental health, volunteering, feeling stressed, and overall satisfaction with life). Cultural participants have significantly better results than non-participants for 101 out of 144 cross-tabulations (or 70%). Cultural participants have significantly worse results for only 10 of the cross-tabulations (or 7%). (Further details about the eight social indicators and 18 cultural activities are provided at the end of this summary.)
Six cultural activities and three social indicators were selected for detailed statistical modeling. The key findings of the statistical models are that:
- Art gallery visits are associated with better health and higher volunteer rates.
- Theatre attendance is associated with better health, volunteering, and strong satisfaction with life.
- Classical music attendance is associated with higher volunteer rates and strong satisfaction with life.
- Pop music attendance is associated with better health, volunteering, and strong satisfaction with life.
- Attendance at cultural festivals is associated with better health, volunteering, and strong satisfaction with life.
- Reading books is associated with better health, volunteering, and strong satisfaction with life.
The statistical models explore whether participation in these arts and culture activities have an association with social indicators above and beyond demographic information. That is, they examine whether cultural participants simply fit the demographic profile of healthy, socially-active citizens, or whether cultural participation might help explain aspects of health and well-being that are beyond demographic analysis.
While the statistical models provide evidence of a connection between cultural activities and well-being, some questions about variables that might have an association with the three indicators of well-being (such as the influence of smoking or alcohol consumption on health) were not available in the General Social Survey. In addition, it is very difficult to provide evidence of a cause and effect relationship between the variables in a statistical model in the absence of an experiment to directly measure the impacts of culture on personal well-being.
Specific findings for each of the six cultural activities
Art gallery attendance
The exploratory data analysis shows that art gallery attendance has a statistically significant connection with six of the eight social indicators. Compared with those who did not visit an art gallery in 2010, art gallery visitors:
- Are much more likely to report that they have very good or excellent health (60% vs. 47%).
- Are much more likely to report that they have very good or excellent mental health (67% vs. 58%).
- Are much more likely to volunteer (50% vs. 31%).
- Are less likely to feel trapped in a daily routine (30% vs. 37%).
- Are more likely to have done a favour for a neighbour in the past month (69% vs. 63%).
- Are slightly more likely to report very strong satisfaction with life (62% vs. 58%).
In a statistical model of health, art gallery visitors have a 35% greater likelihood of reporting very good or excellent health than non-visitors, even accounting for other factors. Art gallery visitors have an 89% greater likelihood of having volunteered in the past year than non-visitors, even after controlling for other factors. In a model of satisfaction with life, art gallery visitors were not shown to have a significantly greater likelihood of reporting very strong satisfaction with life than non-visitors, once other factors were accounted for in the model.
Theatre attendance
Theatre attendance has a statistically significant connection with seven of the eight social indicators. Compared with those who did not attend a play in 2010, theatre attendees:
- Are much more likely to report that they have very good or excellent health (58% vs. 46%).
- Are much more likely to report that they have very good or excellent mental health (67% vs. 57%).
- Are much more likely to volunteer (50% vs. 28%).
- Are less likely to feel trapped in a daily routine (30% vs. 38%).
- Are more likely to know many or most of their neighbours (46% vs. 41%).
- Are more likely to have done a favour for a neighbour in the past month (70% vs. 61%).
- Are more likely to report very strong satisfaction with life (64% vs. 56%).
In a statistical model of health, theatre goers have a 32% greater likelihood of reporting very good or excellent health than non-attendees, even after controlling for other factors. Theatre attendees are 2.29 times more likely than non-attendees to have volunteered in the past year, even accounting for other factors. In a model of satisfaction with life, theatre attendees have a 30% greater likelihood of reporting very strong satisfaction with life than non-attendees, once other factors were accounted for in the model.
Classical music attendance
Classical music attendance has a statistically significant connection with six of the eight social indicators. Compared with those who did not attend a classical concert in 2010, those who did attend:
- Are more likely to report that they have very good or excellent health (58% vs. 51%).
- Are more likely to report that they have very good or excellent mental health (67% vs. 61%).
- Are much more likely to volunteer (55% vs. 35%).
- Are much less likely to feel trapped in a daily routine (26% vs. 36%).
- Are more likely to have done a favour for a neighbour in the past month (71% vs. 64%).
- Are more likely to report very strong satisfaction with life (68% vs. 59%).
In a statistical model of volunteering, classical music attendees have an 86% greater likelihood of having volunteered in the past year than non-attendees, even after controlling for other factors. Classical music attendees are 29% more likely to report very strong satisfaction with life than non-attendees, even accounting for other factors. In the health model, classical music attendees were not shown to have a significantly greater likelihood of reporting very good or excellent health than non-attendees, once demographic factors were accounted for in the model.
Popular music attendance
Pop music attendance has a statistically significant connection with seven of the eight social indicators. Compared with those who did not attend a pop concert in 2010, those who did attend:
- Are much more likely to report that they have very good or excellent health (58% vs. 48%).
- Are more likely to report that they have very good or excellent mental health (66% vs. 59%).
- Are much more likely to volunteer (47% vs. 32%).
- Are less likely to feel trapped in a daily routine (31% vs. 36%).
- Are somewhat more likely to have done a favour for a neighbour in the past month (69% vs. 63%).
- Are slightly more likely to report very strong satisfaction with life (62% vs. 58%).
On the other hand, pop concert attendees are less likely than non-attendees to feel low levels of stress in their daily lives (35% vs. 40% feel not at all or not very stressed).
In a statistical model of health, pop concert attendees have a 23% greater likelihood of reporting very good or excellent health than non-attendees, even after controlling for other factors. Pop music attendees are 64% more likely than non-attendees to have volunteered in the past year, even accounting for other factors. In a model of satisfaction with life, popular music attendees have an 18% greater likelihood of reporting very strong satisfaction with life than non-attendees, once other factors were accounted for in the model.
Attendance at cultural festivals
Cultural festival attendance has a statistically significant connection with five of the eight social indicators. Compared with those who did not attend a cultural festival in 2010, those who did attend:
- Are more likely to report that they have very good or excellent health (56% vs. 49%).
- Are somewhat more likely to report that they have very good or excellent mental health (64% vs. 60%).
- Are much more likely to volunteer (48% vs. 32%).
- Are more likely to have done a favour for a neighbour in the past month (70% vs. 62%).
On the other hand, cultural festival attendees are slightly less likely than non-attendees to feel low levels of stress in their daily lives (35% vs. 40% feel not at all or not very stressed).
In a statistical model of health, cultural festival attendees have a 14% greater likelihood of reporting very good or excellent health than non-attendees, even after controlling for other factors. Festival attendees are twice as likely as non-attendees to have volunteered in the past year, even accounting for other factors. In a model of satisfaction with life, cultural festival attendees have a 25% greater likelihood of reporting very strong satisfaction with life than non-attendees, once other factors were accounted for in the model.
Book reading
Book reading has a statistically significant connection with five of the eight social indicators. Compared with those who did not read a book in 2010, book readers:
- Are much more likely to report that they have very good or excellent health (54% vs. 44%).
- Are more likely to report that they have very good or excellent mental health (63% vs. 56%).
- Are much more likely to volunteer (42% vs. 26%).
- Are less likely to feel trapped in a daily routine (33% vs. 39%).
- Are somewhat more likely to report very strong satisfaction with life (61% vs. 57%).
In a statistical model of health, book readers have a 28% greater likelihood of reporting very good or excellent health than non-readers, even accounting for other factors. Book readers are 74% more likely than non-readers to have volunteered in the past year, even after controlling for other factors. In a model of satisfaction with life, book readers have a 15% greater likelihood of reporting very strong satisfaction with life than non-readers, once other factors were accounted for in the model.
Data source
This Statistical Insights on the Arts report follows similar studies in the United States and Norway that showed a connection between cultural participation and health, well-being, volunteer rates, and other social indicators.
The data in this report are drawn from Statistics Canada’s General Social Survey of 2010, an in-depth telephone survey of about 7,500 Canadians 15 years of age or older. “Cultural attendees” are defined as anyone who went at least once to the relevant cultural activity in 2010. This is a low threshold of cultural participation, as repeated (or deeply engaged) cultural experiences may generate stronger social connections. Also, many cultural activities do not have explicit social goals.
Eight social indicators
The wording of the General Social Survey questions, as well as the researcher-created groupings of the eight social indicators, follows:
- Self-reported health: "In general, would you say your health is: excellent? very good? good? fair? poor?" For this indicator, those responding excellent or very good were compared with those responding good, fair, or poor.
- Self-reported mental health: "In general, would you say your mental health is: excellent? very good? good? fair? poor?" For this indicator, those responding excellent or very good were compared with those responding good, fair, or poor.
- Volunteering: "In the past 12 months, did you do unpaid volunteer work for any organization?" Those who responded yes were compared with those who responded no.
- Feeling trapped in a daily routine: "Do you feel trapped in a daily routine?" Those who responded yes were compared with those who responded no.
- Stress in daily life: "Thinking about the amount of stress in your life, would you say that most days are: … not at all stressful? … not very stressful? … a bit stressful? … quite a bit stressful? … extremely stressful?" For this indicator, those responding not at all or not very were compared with those responding a bit, quite a bit, or extremely.
- Knowledge of neighbours: "Would you say that you know most, many, a few or none of the people in your neighbourhood?" For this indicator, those responding most or many were compared with those responding a few or none.
- Favour for a neighbour: "In the past month, have you done a favour for a neighbour?" Those who responded yes were compared with those who responded no.
- Self-reported satisfaction with life: "Using a scale of 1 to 10 where 1 means "Very dissatisfied" and 10 means "Very satisfied", how do you feel about your life as a whole right now?" For this indicator, those reporting very strong satisfaction with life (i.e., eight or higher) were compared with those reporting lower satisfaction with life (i.e., seven or less). The Canadian average is 7.6, so those reporting eight or higher have above-average satisfaction with life.
Previous reports in the Statistical Insights on the Arts series examined national and provincial data on arts and culture participation, as well as factors in arts attendance. The same 18 arts, culture, and heritage activities have been examined in each of the reports:
- Visiting a public art gallery or art museum (including attendance at special art exhibits)
- Visiting museums other than public art galleries or art museums
- Attending a theatrical performance such as drama, musical theatre, dinner theatre, comedy
- Attending a popular musical performance such as pop, rock, jazz, blues, folk, country and western
- Attending a symphonic or classical music performance
- Attending a cultural or artistic festival (such as film, fringe, dance, jazz, folk, rock, buskers or comedy)
- Attending a performance of cultural or heritage music, theatre or dance (e.g. Aboriginal Peoples, Chinese, Ukrainian)
- Attending any other kind of cultural performance
- Visiting an historic site
- Visiting a zoo, aquarium, botanical garden, planetarium or observatory
- Visiting a conservation area or nature park
- Reading a newspaper
- Reading a magazine
- Reading a book
- Going to a movie or drive-in
- Watching a video
- Listening to downloaded music on a computer, MP3 player, etc.
- Listening to music on CDs, cassette tapes, DVD audio discs, records, etc.
Section 1: Introduction
The arts are an integral part of many Canadians' lives. In addition to showcasing artistic expression and providing entertainment, culture presents opportunities for participants to spend an enjoyable time with family and friends, celebrate their commonalities, explore their differences, experience new works of art, be intellectually stimulated, and respond emotionally to cultural presentations.[fn value=1]For further discussion of attendee motivations and benefits, see Alan S. Brown and Jennifer L. Novak, Assessing the Intrinsic Impacts of a Live Performance, WolfBrown, January 2007, Kelly Hill, Audiences, markets and motivations in the performing arts, Hill Strategies Research Inc., February 2012, and Creative Trust Audience Engagement Survey, Creative Trust for Arts & Culture, December 2010.[/fn]
On a community level, there has been significant research into the connection between the arts and collective well-being, including economic development, community health, sustainable development, rural revitalization, social inclusion, and cultural diversity.[fn value=2]See, for example, Literature Review on the Value and Benefits of Performing Arts Presentation, Inga Petri, Value of Presenting Study (Strategic Moves and CAPACOA), 2012, Developing and Revitalizing Rural Communities through Arts and Culture, Creative City Network of Canada, 2009 and Art and Wellbeing, Deborah Mills and Paul Brown, Australia Council for the Arts, 2004.[/fn]
Building on this body of research, this report examines whether connections exist between Canadians' cultural activities and their personal well-being. Two related research methodologies are used. First, exploratory statistical analysis examines the potential relationships between 18 arts, culture and heritage activities and eight social indicators:
- Self-reported health
- Self-reported mental health
- Volunteering
- Feeling trapped in a daily routine
- Stress level
- Knowledge of neighbours
- Doing a favour for a neighbour
- Self-reported satisfaction with life
Taking the exploratory research as a starting point, the second methodology involves creating detailed statistical models that examine the associations between demographic factors, six cultural activities, and three indicators of well-being: self-reported health, volunteering, and self-reported satisfaction with life. The six cultural activities selected for this in-depth analysis are:
- Art gallery attendance
- Theatre attendance
- Classical music attendance
- Popular music attendance
- Cultural festival attendance
- Book reading
The statistical models explore whether participation in these arts and culture activities have an association with social indicators above and beyond demographic information. That is, they examine whether cultural participants simply fit the demographic profile of healthy, socially-active citizens, or whether cultural participation might help explain aspects of health and well-being that are beyond demographic analysis.
18 cultural activities
The report summarizes data on participation in arts, culture and heritage activities during the 12 months prior to the survey. The data are drawn from Statistics Canada's General Social Survey of 2010, an in-depth telephone survey of about 7,500 Canadians 15 years of age or older.[fn value=3]The number of respondents to the cultural questions was 7,502 in 2010. The analysis of the 2010 data in this report is based on the Statistics Canada General Social Survey (GSS) Time Use – Cycle 24 Public Use Microdata File, 2010. All computations, use and interpretation of these data are entirely that of Hill Strategies Research.[/fn] The 2010 General Social Survey asked Canadians about 18 different arts, culture and heritage activities:
- Visiting a public art gallery or art museum (including attendance at special art exhibits)
- Visiting museums other than public art galleries or art museums
- Attending a theatrical performance such as drama, musical theatre, dinner theatre, comedy
- Attending a popular musical performance such as pop, rock, jazz, blues, folk, country and western
- Attending a symphonic or classical music performance
- Attending a cultural or artistic festival (such as film, fringe, dance, jazz, folk, rock, buskers or comedy)
- Attending a performance of cultural or heritage music, theatre or dance (e.g. Aboriginal Peoples, Chinese, Ukrainian)
- Attending any other kind of cultural performance
- Visiting an historic site
- Visiting a zoo, aquarium, botanical garden, planetarium or observatory
- Visiting a conservation area or nature park
- Reading a newspaper
- Reading a magazine
- Reading a book
- Going to a movie or drive-in
- Watching a video
- Listening to downloaded music on a computer, MP3 player, etc.
- Listening to music on CDs, cassette tapes, DVD audio discs, records, etc.
The report defines a cultural attendee as anyone who went at least once to the relevant cultural activity in 2010.[fn value=4]All of the statistics in this report have been adjusted for non-response. This means that responses of “don’t know” or “not stated” are excluded from the results. The implicit assumption is that those who did not respond or who hung up before completing the survey participated in cultural and heritage activities in the same proportion as those who did respond.[/fn] This is a low threshold of cultural participation, as repeated (or deeply engaged) cultural experiences may generate stronger social connections. In fact, an American study showed that "the more cultural activities people reported attending, the better was their self-reported health".[fn value=5]Anna V Wilkinson et al., Are variations in rates of attending cultural activities associated with population health in the United States?, BMC Public Health, 2007, 7:226, http://www.biomedcentral.com/1471-2458/7/226.[/fn]
Also, many cultural activities do not have explicit social goals and may therefore have limited social effects when compared with those artistic activities that do have an explicit social goal.
Eight indicators of health, well-being, and social connections
In How the Arts Impact Communities, Joshua Guetzkow proposes a typology of how the arts might impact individuals and communities, including connections to health, psychological well-being, interpersonal skills, social capital, as well as community identity and pride.[fn value=6]How the Arts Impact Communities: An introduction to the literature on arts impact studies, Prepared by Joshua Guetzkow for the Taking the Measure of Culture Conference, Princeton University, June 7-8, 2002, page 4.[/fn]. Guetzkow states that "the arts have been said to improve health, mental well-being, cognitive functioning, creative ability and academic performance.[fn value=7]Ibid, page 10.[/fn] The design of this Statistical Insights on the Arts report is quite similar to studies from the United States and Norway that showed a connection between cultural participation and health, well-being, volunteer rates, and other social indicators:
- Art-Goers in their Communities: Patterns of Civic and Social Engagement, National Endowment for the Arts, Research Note 98.[fn value=8]Produit par Bonnie Nichols, octobre 2009. Voir aussi Volunteering and Performing Arts Attendance: More Evidence from the SPPA, Bonnie Nichols, National Endowment for the Arts, note de recherche 94.[/fn] This report showed that "American adults who attend art museums or live art performances are far more likely than non-attendees to vote, volunteer, or take part in other community events."
- Are variations in rates of attending cultural activities associated with population health in the United States?, in BMC Public Health.[fn value=9]Anna V Wilkinson et al., BMC Public Health, 2007, 7:226, http://www.biomedcentral.com/1471-2458/7/226.[/fn] This study found a significant relationship between cultural activities and self-reported health, even controlling for demographic factors. The study also notes that "the more cultural activities people reported attending, the better was their [self-reported health]".
- Patterns of receptive and creative cultural activities and their association with perceived health, anxiety, depression and satisfaction with life among adults: the HUNT study, Norway, in the Journal of Epidemiology and Community Health.[fn value=10]Koenraad Cuypers et al., Journal of Epidemiology and Community Health, 2012, Aug;66(8):698-703. http://jech.bmj.com/content/early/2011/05/04/jech.2010.113571.[/fn] This study showed that participation in cultural activities is "significantly associated with good health, good satisfaction with life, low anxiety and depression scores" among Norwegians.
Eight questions from Statistics Canada's 2010 General Social Survey were selected to help illuminate the potential relationship between cultural participation and personal well-being in Canada. The wording of the General Social Survey questions, as well as the researcher-created groupings of the eight social indicators, follows:
- Self-reported health: "In general, would you say your health is: excellent? very good? good? fair? poor?" For this indicator, those responding excellent or very good were compared with those responding good, fair, or poor.
- Self-reported mental health: "In general, would you say your mental health is: excellent? very good? good? fair? poor?" For this indicator, those responding excellent or very good were compared with those responding good, fair, or poor.
- Volunteering: "In the past 12 months, did you do unpaid volunteer work for any organization?" Those who responded yes were compared with those who responded no.
- Feeling trapped in a daily routine: "Do you feel trapped in a daily routine?" Those who responded yes were compared with those who responded no.
- Stress in daily life: "Thinking about the amount of stress in your life, would you say that most days are: … not at all stressful? … not very stressful? … a bit stressful? … quite a bit stressful? … extremely stressful?" For this indicator, those responding not at all or not very were compared with those responding a bit, quite a bit, or extremely.
- Knowledge of neighbours: "Would you say that you know most, many, a few or none of the people in your neighbourhood?" For this indicator, those responding most or many were compared with those responding a few or none.
- Favour for a neighbour: "In the past month, have you done a favour for a neighbour?" Those who responded yes were compared with those who responded no.
- Self-reported satisfaction with life: "Using a scale of 1 to 10 where 1 means "Very dissatisfied" and 10 means "Very satisfied", how do you feel about your life as a whole right now?" For this indicator, those reporting very strong satisfaction with life (i.e., eight or higher) were compared with those reporting lower satisfaction with life (i.e., seven or less). The Canadian average is 7.6, so those reporting eight or higher have above-average satisfaction with life.
Section 2: Exploratory data for 18 arts, culture and heritage activities
This section provides a brief summary of the cross-tabulations between 18 arts, culture and heritage activities and eight indicators of health, well-being, and social connections.
In general, this report interprets "better" results on the eight indicators of health, well-being, and social connections as: higher self-reported frequency of very good or excellent health; higher self-reported frequency of very good or excellent mental health; higher volunteer rates; lower frequency of feeling trapped in a daily routine; higher frequency of low levels of stress; higher frequency of knowing many or most neighbours; higher frequency of having done a favour for a neighbour in the past month; and higher self-reported frequency of very strong satisfaction with life (i.e., rating of eight to ten).
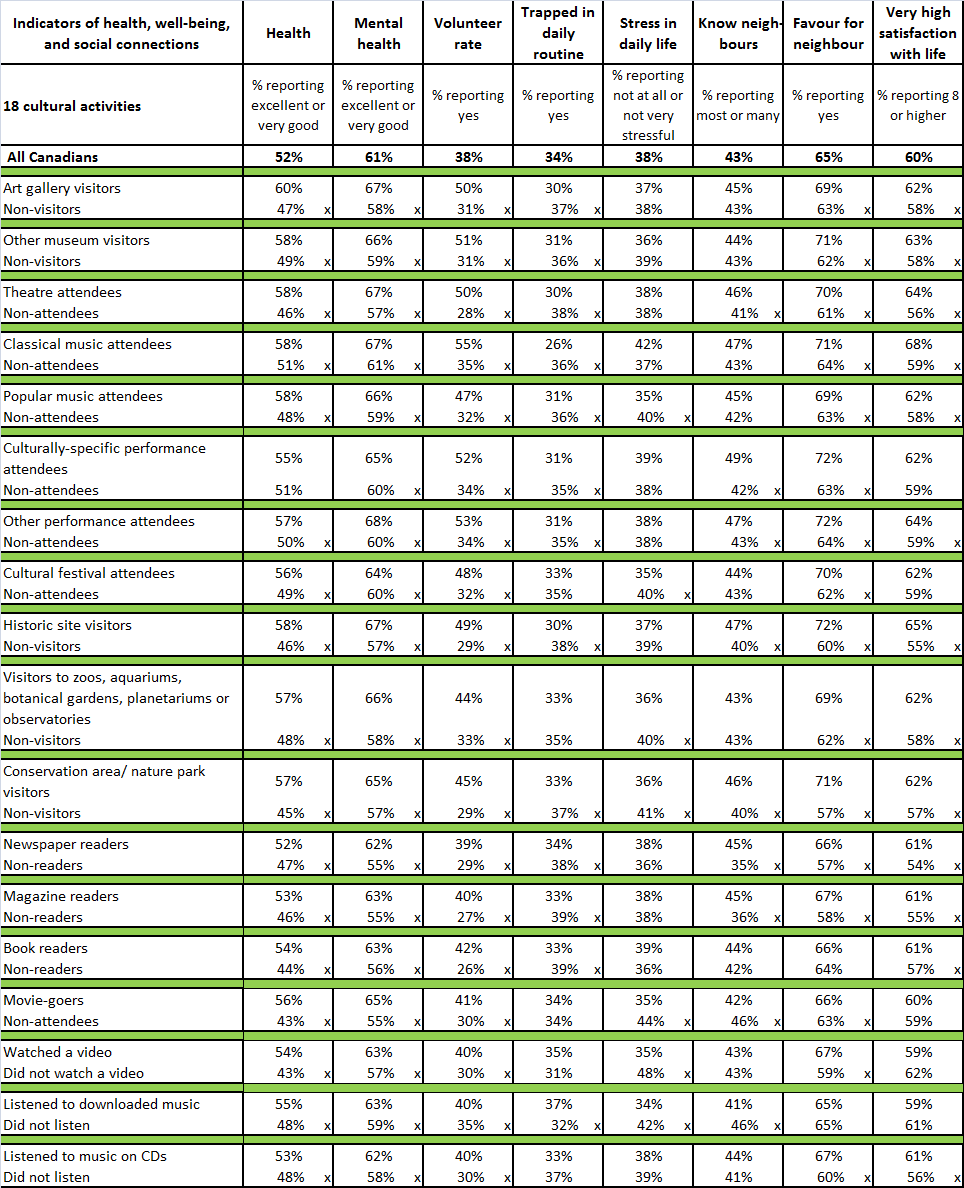
The detailed data (available in the appendix) show that there is a strong connection between cultural activities and eight indicators of health and well-being:
- Out of 144 cross-tabulations (i.e., 18 cultural activities times eight social indicators), cultural participants have better results than non-participants on 123 (or 85%).
- Some of the differences between cultural participants and non-participants are fairly small. Statistical tests (i.e., t-tests) were conducted to examine which differences are statistically significant. Cultural participants have significantly better results for 101 of the cross-tabulations (or 70%).
- Cultural participants have significantly worse results for only 10 of the cross-tabulations (or 7%). Seven of these are related to stress levels. In other words, participants in seven cultural activities reported higher levels of stress than non-participants.
- Participants in 12 of the 18 cultural activities have significantly better results than non-participants on at least six of the eight social indicators. These 12 cultural activities are: art gallery visits; museum visits; theatre attendance; classical music attendance; popular music attendance; culturally-specific performance attendance; attendance at other performances; historic site visits; visits to zoos, aquariums, botanical gardens, planetariums or observatories; park or conservation area visits; newspaper reading; and magazine reading.
Six social indicators show the largest differences between cultural participants and non-participants:
- Volunteer rates (significantly better results for all 18 cultural activities)
- Self-reported mental health (significantly better results for all 18 cultural activities)
- Self-reported health (significantly better results for 17 of the 18 cultural activities)
- Doing a favour for a neighbour (significantly better results for 16 of the 18 cultural activities)
- Satisfaction with life (significantly better results for 13 of the 18 cultural activities)
- Not feeling trapped in a daily routine (significantly better results for 12 of the 18 cultural activities)
Regarding knowledge of neighbours, there are statistically significant differences between cultural participants and non-participants for seven of the 18 cultural activities. For the 11 other cultural activities, participants and non-participants have similar knowledge of their neighbours.
The only social indicator where there is a negative association with some cultural activities is stress levels. For seven cultural activities, participants have significantly higher self-reported levels of stress than non-participants. For the 11 other cultural activities, participants reported similar levels of stress as non-participants.
Full details of the cross-tabulations are provided in the appendix to this report.
The following sections provide more thorough analysis of the connections between the following six cultural activities and eight social indicators:
- Art gallery attendance
- Theatre attendance
- Classical music attendance
- Pop music attendance
- Cultural festival attendance
- Book reading
Each of these sections also provides the key findings of statistical models of connections between the six cultural activities and three indicators of well-being that were key variables in previous research from other countries: self-reported health; volunteering (in the past year); and self-reported satisfaction with life.[fn value=11]A dichotomous structure was created for each of these variables. For self-reported health, ratings of “excellent” or “very good” were separated and compared with ratings of “good”, “fair” or “poor”. Volunteering is a yes/no variable. Self-reported satisfaction with life was separated into very strong ratings (eight or higher) and lower ratings (seven or less).[/fn]
The statistical models include demographic variables that exploratory statistics and similar models from other jurisdictions indicated might be significant. This was done in order to create the best possible models using only demographic factors.[fn value=12]The demographic factors examined in the models are: level of education, household income, age group, sex, children at home (yes/no), region (B.C., Prairies, Ontario, Quebec, Atlantic), urban or rural residence, household language, Aboriginal person (yes/no), visible minority person (yes/no), immigrant (yes/no), and physical activity in the past week (less than 3 days, 3-5 days, 6-7 days).[/fn] At this point, the six arts and culture activities were added separately to the models. The goal was to find whether each of the arts and culture activities have some explanatory value in the models above and beyond demographic information. The goal was not to find the cultural activities that created the best possible overall models of the three indicators of well-being.
While the statistical models might provide evidence of a connection between cultural activities and well-being, some questions about variables that might have an association with the three indicators of well-being (such as the influence of smoking or alcohol consumption on health) were not available in the General Social Survey. In addition, it is very difficult to provide evidence of a cause and effect relationship between the variables in a statistical model in the absence of an experiment to directly measure the impacts of culture on personal well-being.
For more information about the construction of the statistical models, please consult the Technical Supplement to this report (available below).
Section 3: Health, well-being, and social connections of art gallery visitors
In 2010, 35.7% of Canadians 15 years of age or older visited a public art gallery or art museum, including attendance at special art exhibits. This represents 10.0 million Canadians visiting an art gallery during the year.
This section provides an exploratory analysis of the connections between these 10 million art gallery visitors and eight social indicators, followed by a summary of the findings of statistical models of the connections between art gallery visitors and three indicators of well-being: health, volunteering, and satisfaction with life.
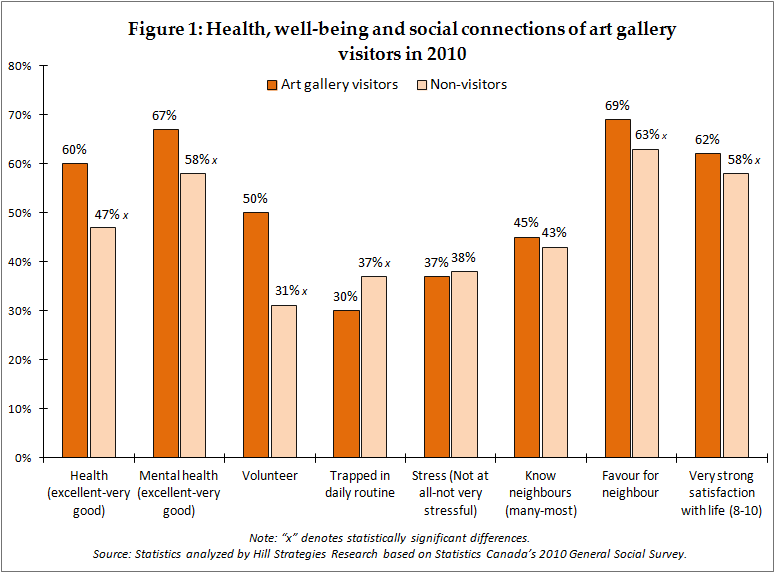
The exploratory data analysis, presented in Figure 1, shows that art gallery attendance has an apparent connection with six of the eight social indicators. Compared with those who did not visit an art gallery in 2010, art gallery visitors:
- Are much more likely to report that they have very good or excellent health (60% vs. 47%).
- Are much more likely to report that they have very good or excellent mental health (67% vs. 58%).
- Are much more likely to volunteer (50% vs. 31%).
- Are less likely to feel trapped in a daily routine (30% vs. 37%).
- Are more likely to have done a favour for a neighbour in the past month (69% vs. 63%).
- Are slightly more likely to report very strong satisfaction with life (62% vs. 58%).
All six of the above differences are statistically significant.
Art gallery visitors are about as likely as non-visitors to feel low levels of stress (37% vs. 38%) and to know many or most of their neighbours (45% vs. 43%).
Art gallery visits associated with better health and higher volunteer rates
The exploratory data analysis above showed that art gallery attendance has an apparent connection with six of the eight social indicators. However, the above statistics did not attempt to factor out the influence of demographic variables. Regression models of art gallery visits and three indicators of well-being (health, volunteering, and satisfaction with life) were created to examine whether art gallery attendance has an association with personal well-being above and beyond demographic factors.
The statistical models indicate that attendance at art galleries is correlated with better health and higher volunteer rates, even keeping other factors constant (such as education level, income level, age, region of the country, level of physical activity, etc.). A statistical model of satisfaction with life did not retain art gallery visits as a significant factor.
In the health model, art gallery visitors have a 35% greater likelihood of reporting very good or excellent health than non-visitors, even after controlling for other factors. Significant demographic factors in the model include physical activity levels, education, household income, age, region of residence, and visible minority status of the respondent. This result indicates that art gallery attendance has an association with better health above and beyond demographic factors.
Art gallery visitors have an 89% greater likelihood of having volunteered in the past year than non-visitors, even accounting for other factors. Significant demographic factors in the model include education, household income, rural residence, age, sex, having children at home, and visible minority status of the respondent.
In a model of satisfaction with life, art gallery visitors were not shown to have a significantly greater likelihood of reporting very strong satisfaction with life than non-visitors, once other factors were accounted for in the model. Significant demographic factors include household income, age, physical activity levels, children at home, rural residence, household language, and visible minority status of the respondent.
Section 4: Health, well-being, and social connections of theatre attendees
In 2010, 44.3% of Canadians 15 or older attended a theatrical performance such as a drama, musical theatre, dinner theatre, comedy (12.4 million Canadians).
This section provides a preliminary analysis of the connections between the 12.4 million theatre attendees and eight social indicators, followed by a summary of the findings of statistical models of the connections between theatre attendees and three indicators of well-being: health, volunteering, and satisfaction with life.
As shown in Figure 2, theatre attendance has an apparent connection with seven of the eight social indicators. Compared with those who did not attend a play in 2010, theatre attendees:
- Are much more likely to report that they have very good or excellent health (58% vs. 46%).
- Are much more likely to report that they have very good or excellent mental health (67% vs. 57%).
- Are much more likely to volunteer (50% vs. 28%).
- Are less likely to feel trapped in a daily routine (30% vs. 38%).
- Are more likely to know many or most of their neighbours (46% vs. 41%).
- Are more likely to have done a favour for a neighbour in the past month (70% vs. 61%).
- Are more likely to report very strong satisfaction with life (64% vs. 56%).
All seven of the above differences are statistically significant.
The same percentage of theatre attendees and non-attendees indicated that they feel not at all or not very stressed in their daily lives (38%).

Theatre attendance associated with better health, volunteering, and strong satisfaction with life
The preliminary data analysis above showed that theatre attendance has a connection with seven of the social indicators. However, the above statistics did not attempt to factor out the influence of demographic variables. Hence, statistical models were created to examine in greater depth the connection between theatre attendees and three social indicators: health, volunteering, and satisfaction with life. The statistical models indicate that theatre attendance is correlated with all three indicators of well-being, even keeping other factors constant (such as education level, income level, age, region of the country, level of physical activity, etc.).
In the health model, theatre goers have a 32% greater likelihood of reporting very good or excellent health than non-attendees, even accounting for other factors. Significant demographic factors in the model include physical activity levels, education, household income, age, region of residence, and visible minority status of the respondent. This result indicates that theatre attendance has an association with better health above and beyond demographic factors.
Theatre attendees are 2.29 times more likely than non-attendees to have volunteered in the past year, even after controlling for other factors. Significant demographic factors in the model include education, household income, age, sex, rural residence, having children at home, region of the country, and visible minority status of the respondent.
In a model of satisfaction with life, theatre attendees have a 30% greater likelihood of reporting very strong satisfaction with life than non-attendees, once other factors were accounted for in the model. Significant demographic factors include education, household income, age, physical activity levels, children at home, rural residence, and household language.
Section 5: Health, well-being, and social connections of classical music attendees
In 2010, 12.6% of Canadians 15 or older attended a symphonic or classical music performance (3.5 million people).
This section provides an exploratory analysis of the connections between the 3.5 million classical music attendees and eight social indicators, followed by a summary of the findings of statistical models of the connections between classical music attendees and three indicators of well-being: health, volunteering, and satisfaction with life.
Figure 3 shows that classical music attendance has an apparent connection with six of the eight social indicators. Compared with those who did not attend a classical concert in 2010, those who did attend:
- Are more likely to report that they have very good or excellent health (58% vs. 51%).
- Are more likely to report that they have very good or excellent mental health (67% vs. 61%).
- Are much more likely to volunteer (55% vs. 35%).
- Are much less likely to feel trapped in a daily routine (26% vs. 36%).
- Are more likely to have done a favour for a neighbour in the past month (71% vs. 64%).
- Are more likely to report very strong satisfaction with life (68% vs. 59%).
All six of the above differences are statistically significant.
For two social indicators, the differences between classical music attendees and non-attendees are not statistically significant:
- Attendees are slightly more likely to feel low levels of stress in their daily lives (42% vs. 37% feel not at all or not very stressed)
- Attendees are slightly more likely to know many or most of their neighbours (47% vs. 43%).

Classical music attendance associated with higher volunteer rates and strong satisfaction with life
The exploratory data analysis above showed that classical music attendance has an apparent connection with six of the eight social indicators. However, the above statistics did not attempt to factor out the influence of demographic variables. Regression models of classical music attendance and three indicators of well-being (health, volunteering, and satisfaction with life) were created to examine whether classical music attendance has an association with personal well-being above and beyond demographic factors.
The statistical models indicate that attendance at classical concerts is correlated with higher volunteer rates and strong satisfaction with life, even keeping other factors constant (such as education level, income level, age, region of the country, level of physical activity, etc.). A statistical model of health did not retain classical music attendance as a significant factor.
In the health model, classical music attendees were not shown to have a significantly greater likelihood of reporting very good or excellent health than non-attendees, once demographic factors were accounted for in the model. Significant demographic factors include physical activity levels, education, household income, age, region of residence, and visible minority status of the respondent.
Regarding volunteering, classical music attendees have an 86% greater likelihood of having volunteered in the past year than non-attendees, even after controlling for other factors. Significant demographic factors in the model include education, household income, rural residence, region of residence, age, sex, having children at home, and visible minority status of the respondent.
Classical music attendees are 29% more likely to report very strong satisfaction with life than non-attendees, even accounting for other factors. Significant demographic factors in the model include household income, age, physical activity levels, children at home, rural residence, household language, visible minority status of the respondent, and education. This result indicates that classical music attendance has an association with strong satisfaction with life above and beyond demographic factors.
Section 6: Health, well-being, and social connections of pop music attendees
In 2010, 39.4% of Canadians 15 or older attended a popular musical performance such as pop/rock, jazz, blues, folk, country and western (11.1 million people).
In this section, a preliminary analysis of the connections between the 11.1 million pop music attendees and eight social indicators is followed by a summary of the findings of statistical models of the connections between popular music attendees and three indicators of well-being: health, volunteering, and satisfaction with life.
Figure 4 shows that pop music attendance has an apparent connection with seven of the eight social indicators. Compared with those who did not attend a pop concert in 2010, those who did attend:
- Are much more likely to report that they have very good or excellent health (58% vs. 48%).
- Are more likely to report that they have very good or excellent mental health (66% vs. 59%).
- Are much more likely to volunteer (47% vs. 32%).
- Are less likely to feel trapped in a daily routine (31% vs. 36%).
- Are somewhat more likely to have done a favour for a neighbour in the past month (69% vs. 63%).
- Are slightly more likely to report very strong satisfaction with life (62% vs. 58%).
On the other hand, pop concert attendees are less likely than non-attendees to feel low levels of stress in their daily lives (35% vs. 40% feel not at all or not very stressed).
All seven of the above differences are statistically significant.
A similar percentage of pop music attendees and non-attendees indicated that they know many or most of their neighbours (45% vs. 42%).

Pop music attendance associated with better health, volunteering, and strong satisfaction with life
The preliminary data analysis above showed that popular music attendance has an apparent (and positive) connection with six of the eight social indicators. However, the above statistics did not attempt to factor out the influence of demographic variables. Hence, statistical models were created to examine in greater depth the connection between pop music attendees and three social indicators: health, volunteering, and satisfaction with life. The statistical models indicate that popular music attendance is correlated with all three indicators of well-being, even keeping other factors constant (such as education level, income level, age, region of the country, level of physical activity, etc.).
In the health model, pop concert attendees have a 23% greater likelihood of reporting very good or excellent health than non-attendees, even accounting for other factors. Significant demographic factors in the model include physical activity levels, education, household income, age, region of residence, and visible minority status of the respondent. This result indicates that popular music attendance has an association with better health above and beyond demographic factors.
Pop music attendees are 64% more likely than non-attendees to have volunteered in the past year, even after controlling for other factors. Significant demographic factors in the model include education, household income, age, sex, rural residence, having children at home, region of the country, and visible minority status of the respondent.
In a model of satisfaction with life, popular music attendees have an 18% greater likelihood of reporting very strong satisfaction with life than non-attendees, once other factors were accounted for in the model. Significant demographic factors include education, household income, age, physical activity levels, children at home, rural residence, and household language.
Section 7: Health, well-being, and social connections of cultural festival attendees
In 2010, 37.2% of the population 15 or over attended a cultural or artistic festival (such as film, fringe, dance, jazz, folk, rock, buskers or comedy) (10.4 million people).
In this section, a preliminary analysis of the connections between the 10.4 million cultural festival attendees and eight social indicators is followed by a summary of the findings of statistical models of the connections between cultural festival attendees and three indicators of well-being: health, volunteering, and satisfaction with life.
Figure 5 shows that cultural festival attendance has an apparent connection with five of the eight social indicators. Compared with those who did not attend a cultural festival in 2010, those who did attend:
- Are more likely to report that they have very good or excellent health (56% vs. 49%).
- Are somewhat more likely to report that they have very good or excellent mental health (64% vs. 60%).
- Are much more likely to volunteer (48% vs. 32%).
- Are more likely to have done a favour for a neighbour in the past month (70% vs. 62%).
On the other hand, cultural festival attendees are slightly less likely than non-attendees to feel low levels of stress in their daily lives (35% vs. 40% feel not at all or not very stressed).
All five of the above differences are statistically significant.
Cultural festival attendees and non-attendees have a relatively similar likelihood of reporting very strong satisfaction with life (62% vs. 59%), feeling trapped in a daily routine (33% vs. 35%), and knowing many or most of their neighbours (44% vs. 43%). These differences are not statistically significant.

Cultural festival attendance associated with better health, volunteering, and strong satisfaction with life
The preliminary data analysis above showed that cultural festival attendance has an apparent (and positive) connection with four of the eight social indicators. However, the above statistics did not attempt to factor out the influence of demographic variables. Hence, statistical models were created to examine in greater depth the connection between cultural festival attendees and three indicators of well-being: health, volunteering, and satisfaction with life. The statistical models indicate that festival attendance is correlated with all three indicators of well-being, even keeping other factors constant (such as education level, income level, age, region of the country, level of physical activity, etc.).
In the health model, cultural festival attendees have a 14% greater likelihood of reporting very good or excellent health than non-attendees, even after controlling for other factors. Significant demographic factors in the model include physical activity levels, education, household income, age, region of residence, and visible minority status of the respondent. This result indicates that popular music attendance has an association with better health above and beyond demographic factors.
Festival attendees are twice as likely as non-attendees to have volunteered in the past year, even accounting for other factors. Significant demographic factors in the model include education, household income, age, sex, rural residence, having children at home, region of the country, and visible minority status of the respondent.
In a model of satisfaction with life, cultural festival attendees have a 25% greater likelihood of reporting very strong satisfaction with life than non-attendees, once other factors were accounted for in the model. Significant demographic factors include education, household income, age, physical activity levels, children at home, rural residence, and household language.
Section 8: Health, well-being, and social connections of book readers
In 2010, 75.7% of Canadians 15 or older read at least one book (21.3 million Canadians).
This section provides an exploratory analysis of the connections between the 21.3 million book readers and eight social indicators, followed by a summary of the findings of statistical models of the connections between book readers and three indicators of well-being: health, volunteering, and satisfaction with life.
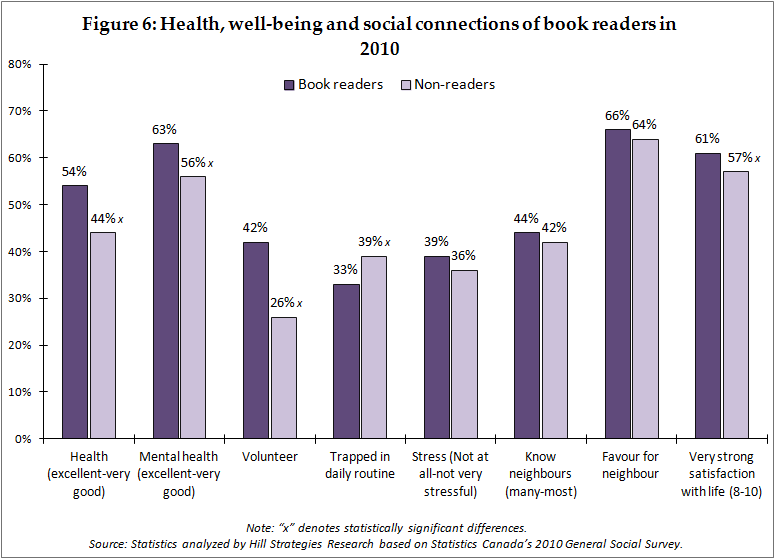
The exploratory data analysis, presented in Figure 6, shows that book reading has an apparent connection with five of the eight social indicators. Compared with those who did not read a book in 2010, book readers:
- Are much more likely to report that they have very good or excellent health (54% vs. 44%).
- Are more likely to report that they have very good or excellent mental health (63% vs. 56%).
- Are much more likely to volunteer (42% vs. 26%).
- Are less likely to feel trapped in a daily routine (33% vs. 39%).
- Are somewhat more likely to report very strong satisfaction with life (61% vs. 57%).
All five of the above differences are statistically significant.
A similar proportion of book readers and non-readers know many or most of their neighbours (44% vs. 42%) or have done a favour for a neighbour in the past month (66% vs. 64%). In addition, book readers are slightly more likely to feel low levels of stress (39% vs. 36%). These differences are not statistically significant.
Reading books associated with better health, volunteering, and strong satisfaction with life
The exploratory data analysis above showed that reading books has an apparent connection with five of the eight social indicators. However, the above statistics did not attempt to factor out the influence of demographic variables. Hence, statistical models were created to examine in greater depth the connection between book reading and three social indicators: health, volunteering, and satisfaction with life. The statistical models indicate that book reading is correlated with all three indicators of well-being, even keeping other factors constant (such as education level, income level, age, region of the country, level of physical activity, etc.).
In the health model, book readers have a 28% greater likelihood of reporting very good or excellent health than non-readers, even accounting for other factors. Significant demographic factors in the model include physical activity levels, education, household income, age, region of residence, and visible minority status of the respondent. This result indicates that theatre attendance has an association with better health above and beyond demographic factors.
Book readers are 74% more likely than non-readers to have volunteered in the past year, even after controlling for other factors. Significant demographic factors in the model include education, household income, age, sex, rural residence, having children at home, region of the country, and visible minority status of the respondent.
In a model of satisfaction with life, book readers have a 15% greater likelihood of reporting very strong satisfaction with life than non-readers, once other factors were accounted for in the model. Significant demographic factors include education, household income, age, physical activity levels, children at home, rural residence, visible minority status of the respondent, and household language.
Appendix: Table
Indicators of health, well-being, and social connections of participants and non-participants in 18 arts, culture and heritage activities in 2010
Note: “x” denotes statistically significant differences
Source: All statistics analyzed by Hill Strategies Research based on Statistics Canada’s 2010 General Social Survey
Full Report
Other Resources
http://hillstrategies.com/wp-content/uploads/2013/01/Figure1_en.png http://hillstrategies.com/wp-content/uploads/2013/01/Figure2_en.png http://hillstrategies.com/wp-content/uploads/2013/01/Figure3_en.png http://hillstrategies.com/wp-content/uploads/2013/01/Figure4_en.png http://hillstrategies.com/wp-content/uploads/2013/01/Figure5_en.png http://hillstrategies.com/wp-content/uploads/2013/01/Figure6_en.png http://hillstrategies.com/wp-content/uploads/2013/01/Appendix_table.png http://hillstrategies.com/wp-content/uploads/2013/01/Arts_well_being2010_ExecSumm_0.pdf http://hillstrategies.com/wp-content/uploads/2013/01/Arts_well_being2010_Technical_Supplement.pdf
