


Educating artists
An analysis of the educational backgrounds of working artists and the labour market activities of arts program graduates in Canada
Executive Summary
This report has a two-pronged goal: 1) to examine the post-secondary educational qualifications of artists in Canada; and 2) to provide information about the occupations and workforce characteristics of graduates of post-secondary arts programs.
Data for the report are drawn from the National Household Survey (2011) and the National Graduates Survey (2009/10 graduates, surveyed in 2013).
Two recent American reports were influential in the framing of this report: Artists Report Back: A National Study on the Lives of Art Graduates and Working Artists and Making It Work: The Education and Employment of Recent Arts Graduates. An older Statistics Canada article (Labour market outcomes of arts and culture graduates) was also helpful in the development of this report.[1]

Artists: Diverse array of educational backgrounds
According to data from the 2011 National Household Survey, artists come from a diverse array of educational backgrounds. As shown in Figure ES1, over one-quarter of the 134,500 Canadian artists 25 or older (28%) graduated from a post-secondary visual or performing arts program.
Three other groups of post-secondary programs each account for 5% or 6% of artists:
- Education (6%)
- Communications and journalism (also 6%)
- Business, management, and marketing (5%)
Four percent of artists graduated from English language or literature programs.

11% of visual and performing arts graduates work as artists (NHS 2011)
There are 13.7 million Canadians 25 or older who have completed post-secondary studies, including nearly 400,000 who have completed a post-secondary visual and performing arts program (396,400, or 2.9% of all post-secondary graduates 25 or older).

Figure ES2 shows that, among the 326,300 visual and performing arts graduates who were in the labour force in May of 2011, 11% worked as artists. Another 20% worked in other occupations within the broad category of arts, culture, recreation, or sports.
Between 10% and 20% of visual and performing arts graduates worked in sales and service occupations (18%), business, finance, and administration occupations (14%), management occupations (11%), and occupations in education, law and social, community, or government services (also 11%). Two other occupation groups each accounted for 5% of visual and performing arts graduates: natural and applied sciences; and trades, transport, and equipment operators.

Limited overlap between visual and performing arts graduates and working as an artist (NHS, 2011)
One of the key findings of a recent American report (Artists Report Back: A National Study on the Lives of Art Graduates and Working Artists) was a “surprising” lack of overlap between working artists and arts graduates. In that study, 16% of artists were art graduates, and 10% of arts graduates were found to be artists.
While the American study used different definitions of “artists” and “arts graduates”, the findings from our Canadian research are relatively similar, especially regarding the occupations of arts graduates:
- 28% of the 134,500 Canadian artists 25 or older graduated from a post-secondary visual or performing arts program.
- 11% of the 326,300 visual and performing arts graduates who were in the labour force in May of 2011 worked as artists.
The overlap between visual and performing arts graduates and working artists is depicted in Figure ES3.

16,100 arts and communications graduates in 2009/10 (NGS)
Statistics Canada’s National Graduates Survey provides detailed information about post-secondary graduates in 2009/10 using an aggregated combination of educational programs. In the National Graduates Survey, the closest grouping for “arts graduates” is those who graduated from a visual or performing arts program as well as those who graduated from a communications technology program at the post-secondary level. The inclusion of communications technology programs is not ideal for the analysis here. However, in the overall labour force in 2011, graduates of visual or performing arts programs represented 84% of workers in the aggregated grouping, while communications technologies accounted for only 16% of the aggregated grouping. This grouping of programs is labelled “arts and communications” in this report.
There are 16,100 Canadians who, in 2009/10, graduated from an arts or communications program. Arts and communications graduates were slightly more likely than other graduates to have pursued their studies in Quebec (28% of arts and communications graduates vs. 24% of all graduates) and slightly less likely to have done so in the four Atlantic provinces (4% vs. 7%). In Ontario, the four western provinces, and the three territories, the percentage of arts and communications graduates was similar to the percentage of all graduates.
Sources of funding and student debt (NGS, 2009/10)
The most common sources of funding for arts and communications students who graduated in 2009/10 were parents (reported by 65% of graduates), employment savings (64%), and personal savings (59%). Two other funding sources were reported by about one-half of arts and communications graduates: government student loans (50%); and scholarships, awards, or prizes (45%).
For those graduates who had borrowed money from any source for their post-secondary education, the debt load of arts and communications graduates at the time of their graduation in 2009/10 was fairly similar to the debt load of other graduates:
- 17% of arts and communications graduates (compared with 21% of all graduates) had no debt load at graduation.
- A similar percentage of arts and communications graduates (11%) and all graduates (10%) had a debt load between $1 and $4,999.
- 15% of arts and communications graduates and 13% of all graduates had a debt load between $5,000 and $9,999.
- 32% of arts and communications graduates and 29% of all graduates had a debt load between $10,000 and $24,999.
- The same percentage of arts and communications graduates and all graduates (26%) had a student debt load (from all sources) of $25,000 or more.
Signs of underemployment of recent arts and communications graduates (NGS, 2009/10)
While the data in this report are not definitive, recent arts and communications graduates may be underemployed compared with other recent post-secondary graduates. In particular, arts and communications graduates are much less likely than all graduates to hold a job that is closely related to their studies (36% vs. 58%). Similarly, only 46% of arts and communications graduates indicated that the job they held at the time of the survey was the job that they had hoped to have after graduating, compared with 62% of all graduates.
Furthermore, arts and communications graduates are much more likely than other graduates to have held a low-paying position at the time of the survey: 23% of arts and communications graduates worked at a job with gross annual earnings below $20,000, compared with 10% of all graduates. Arts and communications graduates are much more likely than other graduates to be employed in sales and service occupations (22% vs. 13%).
Arts and communications graduates are also much more likely than other graduates to have had many employers in the three years since their graduation: 18% of arts and communications graduates (vs. 8% of all graduates) had four or more employers since their graduation.
Despite these labour market challenges, 72% of recent arts and communications graduates would choose the same program of studies again. This is only slightly less than the percentage of all graduates (76%).
Methodological notes
- Nine of Statistics Canada’s detailed occupation codes (NHS, 2011) are included as artists in this report:
- Actors and comedians
- Artisans and craftspersons
- Authors and writers
- Conductors, composers, and arrangers
- Dancers
- Musicians and singers
- Other performers
- Producers, directors, choreographers, and related occupations
- Visual artists
- Individuals are classified in the occupation in which they worked the most hours during a specific reference week. If they did not work during the reference week, they are classified based on the job at which they worked the longest since January 1, 2010.
- Artists who spent more time at another occupation than at their artwork during the reference week would be categorized in the other occupation.
- Artists who teach in post-secondary, secondary, or elementary schools are classified as teachers or professors and are therefore excluded from the count of artists. Instructors and teachers in some settings (such as private arts schools, academies, and conservatories) are included in the arts occupations.
- Individuals who are employed or self-employed are captured in each occupation.
Section 1: Introduction
This report analyzes data from the National Household Survey and the National Graduates Survey, two data sources that provide useful information regarding the educational backgrounds of artists and the labour market situations of arts program graduates.
The report contains three main elements:
- First, the post-secondary education programs of working artists in Canada are examined, based on the 2011 National Household Survey.
- Second, the labour market activities of all post-secondary visual and performing arts program graduates in Canada are analyzed, whether or not the graduates work as artists. Data on this topic are drawn from the 2011 National Household Survey.
- Third, the report examines information about recent graduates (2009/10 school year) of Canadian public post-secondary arts programs, whether or not they work as artists. This information is drawn from the 2013 National Graduates Survey.
Two recent American reports were influential in the framing of this report: Artists Report Back: A National Study on the Lives of Art Graduates and Working Artists and Making It Work: The Education and Employment of Recent Arts Graduates. An older Statistics Canada article (Labour market outcomes of arts and culture graduates) was also helpful in the development of this report.[2]
Working artists (NHS, 2011)
Nine of Statistics Canada’s detailed occupation codes are included as artists in this report:
- Actors and comedians.
- Artisans and craftspersons.
- Authors and writers.
- Conductors, composers and arrangers.
- Dancers.
- Musicians and singers.
- Other performers (including circus performers, magicians, models, puppeteers, and other performers not elsewhere classified).
- Producers, directors, choreographers, and related occupations.
- Visual artists (categorized by Statistics Canada as “Painters, sculptors and other visual artists”).
The appendix contains full descriptions of these occupations.
Individuals are classified in the occupation in which they worked the most hours during a specific reference week. If they did not work during the reference week, they are classified based on the job at which they worked the longest since January 1, 2010. Artists who spent more time at another occupation than at their artwork during the reference week would be categorized in the other occupation.
Additional methodological details from the National Household Survey include the following:
- Artists who teach in post-secondary, secondary, or elementary schools are classified as teachers or professors and are therefore excluded from the count of artists. Instructors and teachers in some settings (such as private arts schools, academies, and conservatories) are included in the arts occupations.
- Individuals who are employed or self-employed are captured in each occupation.
This report does not cover all of the details that might be desired regarding the educational backgrounds of working artists and the situation of arts graduates. In the analysis of working artists, differences in artists’ incomes by educational programs are not available.
Visual and performing arts program graduates (NHS, 2011)
The analysis of arts graduates focusses, for the most part, on graduates of visual and performing arts programs. Visual and performing arts programs include “instructional programs that focus on the creation and interpretation of works and performances that use auditory, kinesthetic, and visual phenomena to express ideas and emotions in various forms, subject to aesthetic criteria”. Detailed programs included in this category are: Crafts/craft design, folk art and artisanry; Dance; Design and applied arts; Drama/theatre arts and stagecraft; Film/video and photographic arts; Fine arts and art studies; Music; and Arts, entertainment, and media management.[3]
This focus was used because of database limitations (i.e., incomplete breakdowns of instructional programs) as well as concerns regarding statistical reliability of data based on very specific fields of study. It should also be noted that data on the labour market outcomes of graduates of specific arts training institutions are not available.
For further information and a more detailed examination of the limitations of the methodology of the National Household Survey, see our statistical profile of artists in Canada in 2011 as well as our detailed report on the methodology of data sources on artists in Canada.
Recent arts graduates (NGS, 2009/10)
The source of data regarding recent graduates – the National Graduates Survey – surveyed graduates of Canadian public post-secondary education institutions from the 2009/10 school year. The survey did not cover individuals who took occupation-specific training outside of public post-secondary institutions, such as private post-secondary education organizations, apprenticeship programs, and more. This may be particularly common for some types of artists, such as dancers and craftspeople.
The data on recent arts graduates are based on an aggregated combination of educational programs developed by Statistics Canada as part of the National Graduates Survey. These data were readily available for inclusion in this report. In the aggregated grouping of programs, the closest grouping for “arts graduates” is those who graduated from a visual or performing arts program as well as those who graduated from a communications technology program at the post-secondary level. The inclusion of communications technology programs is not ideal for the analysis here. However, in the overall labour force in 2011, graduates of visual or performing arts programs represented 84% of workers in the aggregated grouping, while communications technologies accounted for only 16% of the aggregated grouping. In addition, the communications technologies grouping contains some animation and design programs, and 5% of graduates of communications technologies programs were artists in 2011.
The analysis of recent arts graduates excludes those who took a post-secondary writing or literature program, as these programs were aggregated into a “humanities” category in the available data. Some information about humanities graduates will be provided in this report, but the humanities grouping is not the main focus of the report.
Therefore, the section on recent arts graduates includes graduates of visual arts, performing arts, and communications programs from Canadian public, post-secondary institutions but excludes humanities graduates as well as graduates of occupation-specific training programs outside of public post-secondary institutions.
Section 2: Post-secondary education of artists
This section provides information about the post-secondary educational qualifications of 134,500 Canadians 25 years of age or older who were classified as artists in the 2011 National Household Survey (whether or not they were in the labour force during the reference week).
Education levels of artists

As noted in our statistical profile of artists in Canada in 2011, Canada’s artists have much higher levels of formal education than the overall labour force. In fact, 77% of artists 25 or older (104,000 people) have a post-secondary certificate, diploma, or degree, compared with 67% of all workers 25 or older.
More specifically, the percentage of artists (25 or older) with a bachelor’s degree or higher (46%) is much higher than the percentage in the overall labour force (28%).
The percentages of artists with a college or CEGEP certificate or diploma (20%) or a university certificate or diploma below the bachelor’s level (6%) are very similar to the equivalent percentages in the overall labour force (22% and 5%, respectively).
Many fewer artists (5%) than other workers (13%) have obtained an apprenticeship or trades certificate or diploma.
Figure 1 provides a breakdown of the educational attainment of artists 25 years of age or older.

Figure 2 shows the percentage of artists by occupation who have attained a university degree or higher education. As noted above, the percentage of all artists 25 or older with a bachelor’s degree or higher (46%) is much higher than the percentage in the overall labour force (28%). University degrees are particularly common among authors and writers (66%) as well as conductors, composers, and arrangers (56%). Both of these occupations also have above-average percentages of people with graduate degrees, certificates, or diplomas (which are included in the percentage of people with a university degree): 26% of authors and 25% of conductors, compared with 16% of all artists.
Two other arts occupations have slightly above-average proportions of people with at least a bachelor’s degree: musicians and singers (49%) and producers, directors, choreographers, and related occupations (48%), compared with 46% of all artists. Many producers, directors, and choreographers also choose to pursue a college, CEGEP, or other non-university certificate or diploma (26%, higher than the average for all artists: 20%).
Arts occupations where university graduates are less common include artisans and craftspersons (21%), other performers (23%), and dancers (29%). For these three arts occupations, an examination of the categories available in the National Household Survey shows that:
- An above-average proportion of artisans and craftspersons have an apprenticeship or trades certificate or diploma (13%, vs. 5% for all artists), a high school diploma (27%, vs. 17% for all artists), or less than a high school diploma (13%, vs. 5% for all artists).
- An above-average proportion of other performers have a high school diploma (29%, vs. 17% for all artists) or less than a high school diploma (15%, vs. 5% for all artists).
- A relatively high proportion of dancers have a high-school diploma or equivalent (26%, compared with an average of 17% for all artists).
Many of these artists might pursue occupation-specific training programs outside of public post-secondary institutions (which would not be captured by the NHS).
Two other arts occupations have slightly below-average proportions of people with at least a bachelor’s degree: actors and comedians (38%) and visual artists (42%), compared with 46% of all artists.

Artists: Diverse array of educational backgrounds
Figure 3 shows that artists come from a diverse array of educational backgrounds. Over one-quarter of Canadian artists 25 or older (28%) graduated from a post-secondary visual or performing arts program. Visual and performing arts programs include “instructional programs that focus on the creation and interpretation of works and performances that use auditory, kinesthetic, and visual phenomena to express ideas and emotions in various forms, subject to aesthetic criteria”. Detailed programs included in this category are: Crafts/craft design, folk art and artisanry; Dance; Design and applied arts; Drama/theatre arts and stagecraft; Film/video and photographic arts; Fine arts and art studies; Music; and Arts, entertainment, and media management.[4]
This is by far the most common instructional program group among artists. Three other groups of post-secondary programs each account for 5% or 6% of artists: education; communications and journalism; and business, management, and marketing.
Business, management, and marketing is the most common group of post-secondary programs among all Canadian workers (12%).

Detailed post-secondary programs of artists
An examination of more detailed data shows that five of the twelve post-secondary programs with at least 2% of working artists (25 or older) are within the visual and performing arts grouping:
- Music: 11% (15,400 artists)
- Fine arts and art studies: 6% (8,100 artists)
- Drama / theatre arts and stagecraft: 3% (4,400 artists)
- Film / video and photographic arts: 3% (4,100 artists)
- Design and applied arts: 2% (2,600 artists)
At least 2% of artists studied in two post-secondary education programs:
- Education, general: 3% (3,900 artists)
- Teacher education and professional development, specific subject areas: 2% (3,000 artists)
Two post-secondary communications and journalism programs represent 2% of artists:
- Communication and media studies: 2% (3,200 artists)
- Journalism: 2% (2,700 artists)
Three other programs have at least 2% of artists:
- Liberal arts and sciences, general studies, and humanities: 3% (4,000 artists)
- English language and literature, general: 2% (2,800 artists)
- Audiovisual communications technologies / technicians: 2% (2,700 artists)[5]
Post-secondary programs of different types of artists
While post-secondary visual or performing arts programs are by far the most common instructional program group among artists (28% of all artists), the educational paths of artists vary substantially by arts occupation. What is common among the nine arts occupations is the fact that only a minority of artists have completed the post-secondary program that is most directly related to their arts occupation.
Literary arts:
- 13% of authors and writers have completed a post-secondary program in English language and literature / letters, which is part of the humanities group (25% of writers). English programs are followed closely by communication, journalism, and related programs (12% of writers). Only 11% of writers have not completed a post-secondary program.
Visual arts and crafts:
- 9% of artisans and craftspersons have completed a post-secondary fine arts or art studies program, which is classified within the visual and performing arts group (14%). No other program group accounts for more than 6% of artisans and craftspersons. Forty percent of artisans and craftspersons have not completed a post-secondary program, although some may have completed arts-specific training outside of post-secondary institutions. These programs would not be captured in the National Household Survey.
- 23% of visual artists have completed a post-secondary fine arts or art studies program, while 6% have completed a design or applied arts program. Both of these programs are classified within the most common broad program group for visual artists (visual and performing arts programs: 36%). One-quarter of visual artists (25%) have not completed a post-secondary program.
Performing arts and film:
- 12% of dancers have completed a post-secondary dance program, while 11% have completed an education program. The most common broad program group among dancers is visual and performing arts programs (21%). One-third of dancers (33%) have not completed a post-secondary program. Many dancers may have completed dance-specific training outside of post-secondary institutions. These programs would not be captured in the National Household Survey.
- 14% of producers, directors, choreographers, and related occupations have completed a post-secondary program in film, video, or photographic arts. This program is classified within the broader group of visual and performing arts programs (27%). The second most common program group is communication, journalism, and related programs (16%). Sixteen percent of producers, directors, and choreographers have not completed a post-secondary program.
- About one-quarter of actors and comedians (27%) have completed a post-secondary program in drama, theatre arts, or stagecraft, which is classified within the broader group of visual and performing arts programs (37%). Twenty-six percent of actors and comedians have not completed a post-secondary program.
- One-third of conductors, composers, and arrangers (33%) have completed a post-secondary music program. This program is classified within the broader group of visual and performing arts programs (39%). Twenty percent of conductors, composers, and arrangers have not completed a post-secondary program.
- 41% of musicians and singers have completed a post-secondary music program, which is within the broader group of visual and performing arts programs (44%). Twenty-four percent of musicians and singers have not completed a post-secondary program.
- There is no dominant post-secondary program among other performers (which includes circus performers, magicians, puppeteers, etc.). Only 14% of other performers have completed a visual or performing arts program. No other group of programs accounts for more than 5% of other performers. Forty-four percent of other performers have not completed a post-secondary program, the largest such percentage among the nine arts occupations.
Arts-trained artists by province
As noted above, 28% of Canadian artists 25 or older graduated from a post-secondary visual or performing arts program. This rate varies somewhat by province, as shown in Map 1:
- There are 8,700 artists in Quebec who have graduated from a post-secondary visual or performing arts program, representing 31% of all artists in Quebec.
- In British Columbia, the 7,300 artists who have graduated from a post-secondary visual or performing arts program account for 29% of all artists in the province.
- Manitoba’s 1,100 artists who have graduated from a post-secondary visual or performing arts program represent 27% of all artists in the province.
- Similarly, the 15,200 artists in Ontario who have graduated from a post-secondary visual or performing arts program account for 27% of all artists in the province.
- In Alberta, the 2,900 artists who have graduated from a post-secondary visual or performing arts program represent 26% of all artists.
- Saskatchewan’s 700 artists who have graduated from a post-secondary visual or performing arts program represent 25% of all artists in the province.
- There are 800 artists in Nova Scotia who have graduated from a post-secondary visual or performing arts program, representing 23% of all artists.
In New Brunswick, Prince Edward Island, Newfoundland and Labrador, as well as the three territories, the number of artists who have graduated from a visual or performing arts program is not reliable.

Section 3: Arts graduates in the labour force
While the previous section provided information about the post-secondary education programs of working artists, this section examines the labour market activities of all graduates of public post-secondary visual and performing arts programs, whether or not the graduates work as artists. Data on this topic are drawn from the 2011 National Household Survey.
According to the 2011 National Household Survey, there are 13.7 million Canadians 25 or older who have completed post-secondary studies, including nearly 400,000 who have completed a post-secondary visual and performing arts program (396,400, or 2.9% of all post-secondary graduates 25 or older).
Many other post-secondary programs have more graduates in the workforce:
- Business, management, and public administration: 22% of all post-secondary graduates
- Architecture, engineering, and related technologies: also 22%
- Health and related fields: 14%
- Social and behavioural sciences and law: 10%
- Education: 8%
- Personal, protective, and transportation services: 6%
- Humanities: 5%
- Mathematics, computer, and information sciences: 4%
- Physical and life sciences and technologies: 3%
There are slightly more visual and performing arts graduates than graduates from agriculture, natural resources, and conservation programs (2.2% of all graduates 25 or older).
Demographic information about visual and performing arts graduates
College and university programs have both been popular choices for visual and performing arts graduates:
- 9% have obtained an apprenticeship or trades certificate or diploma.
- 43% have obtained a college, CEGEP or other non-university certificate or diploma.
- 10% have obtained a university certificate or diploma below bachelor level.
- 38% have obtained a university certificate, diploma or degree at bachelor level or above (including 28% with a bachelor’s degree and 10% with a university certificate, diploma, or degree above the bachelor’s level).
Women represent a higher proportion of graduates of visual and performing arts programs (59%) than all post-secondary programs (51%).
For both visual and performing arts graduates and all graduates, women represent a higher proportion of graduates than workers. As shown in Figure 4, 51% of all post-secondary graduates are female, compared with 48% of all workers. Similarly, 59% of visual and performing arts graduates are female, compared with 51% of working artists.

Younger people appear to be particularly drawn to visual and performing arts programs. Graduates from visual and performing arts programs are more likely to be under 35 years of age than all post-secondary graduates:
- 31% of arts graduates are between 25 and 34 years of age, compared with 22% of all graduates.
- 23% of arts graduates are between 35 and 44 years of age, the same percentage as all graduates.
- 22% of arts graduates are between 45 and 54 years of age, compared with 24% of all graduates.
- 15% of arts graduates are between 55 and 64 years of age, compared with 18% of all graduates.
- 10% of arts graduates are 65 or older, compared with 14% of all graduates.
One-quarter of visual and performing arts graduates are immigrants (26%), a percentage that is essentially equal to all graduates (27%).
Nearly 2% of visual and performing arts graduates are Aboriginal (1.8%). This is slightly lower than the percentage of all graduates (2.6%).
Nearly one-third of visual and performing arts graduates (30%) moved to a different province (18%) or outside the country (12%) to pursue their post-secondary program. Seventy percent stayed within their province of residence for their visual and performing arts program. The percentage moving out-of-province or out-of-country is slightly lower for all post-secondary graduates (28%, including just over 10% out-of-province and just over 17% out-of-country).
Labour force participation and occupations of arts graduates
The labour force participation rate is very high among visual and performing arts graduates (78.7%), compared with all post-secondary graduates (72.6%). However, among graduates who were in the labour force in May of 2011, a slightly higher proportion of visual and performing arts graduates than all graduates were unemployed (6.4% vs. 5.7%).
Figure 5 shows that, among the 326,300 visual and performing arts graduates who are in the labour force, 11% work as artists. Another 20% work in other occupations within the broad category of arts, culture, recreation, or sports.
Between 10% and 20% of visual and performing arts graduates work in sales and service occupations (18%), business, finance, and administration occupations (14%), management occupations (11%), and occupations in education, law and social, community, or government services (also 11%). Two other occupation groups each account for 5% of visual and performing arts graduates: natural and applied sciences; and trades, transport, and equipment operators.

Arts graduates by province
As noted above, visual and performing arts graduates represent 2.9% of all post-secondary graduates in Canada. The concentration of arts graduates varies by province, as shown in Map 2:
- British Columbia’s 66,400 arts graduates represent 3.5% of all post-secondary graduates in the province.
- The 105,200 arts graduates in Quebec account for 3.2% of all post-secondary graduates.
- Ontario’s 163,000 arts graduates represent 3.1% of all post-secondary graduates in the province.
- The 32,500 arts graduates in Alberta account for 2.2% of all post-secondary graduates.
- Similarly, Manitoba’s 9,200 arts graduates represent 2.2% of all post-secondary graduates in the province.
- In Nova Scotia, the 6,500 arts graduates represent 1.7% of all post-secondary graduates.
- The 900 arts graduates on Prince Edward Island account for 1.6% of all post-secondary graduates in the province.
- Saskatchewan’s 5,500 arts graduates represent 1.5% of all post-secondary graduates.
- The 4,100 arts graduates in New Brunswick account for 1.5% of all post-secondary graduates in the province.
- In Newfoundland and Labrador, the 2,600 arts graduates represent 1.3% of all post-secondary graduates.
In the three territories (grouped together), the 620 arts graduates account for 1.7% of all territorial residents who have graduated from a post-secondary program. The number of arts graduates in each individual territory is not reliable.

Section 4: Recent arts graduates (2009/10 school year)
This section provides information about graduates of Canadian public post-secondary arts programs from the 2009/10 school year, whether or not they work as artists. This information is drawn from the 2013 National Graduates Survey (NGS), which asked respondents a series of questions about their post-secondary programs, program funding, as well as their labour market activities after graduating.
The data on recent arts graduates are based on an aggregated combination of educational programs developed by Statistics Canada as part of the National Graduates Survey. These data were readily available for inclusion in this report. In the aggregated grouping of programs, the closest grouping of arts graduates is those who graduated from a visual or performing arts program as well as those who graduated from a communications technology program at the post-secondary level.[6] This grouping of programs will be labelled “arts and communications” in this section.
The arts and communications grouping does not include those who took a post-secondary writing or literature program, as these programs are aggregated into a humanities category. Some information about humanities graduates will be provided here, but the humanities grouping is not the main focus of the section.
Thirty percent of artists 25 or older have graduated from a visual or performing arts program or a communications technology program. Another 11% of artists have graduated from a humanities program, which is slightly lower than the percentage graduating from social and behavioural sciences and law programs (12% of artists).
Education levels of recent arts and communications graduates
There are 16,100 Canadians who, in 2009/10, graduated from an arts or communications program. Of these:
- 41% received a college or CEGEP diploma or certificate
- 52% received a bachelor’s degree (or first professional degree or university diploma or certificate below the bachelor’s level)
- 8% received a Master’s degree, a doctorate, or a university diploma or certificate above the bachelor’s level
In comparison, among all post-secondary graduates in 2009/10, 35% completed a college or CEGEP diploma or certificate, 51% received a bachelor’s degree, and 14% received a post-bachelor’s degree or certificate.
Humanities graduates were much more likely than arts and communications or all post-secondary graduates to have completed a bachelor’s degree (77% of humanities graduates), rather than a college or CEGEP program (11%). Another 12% of humanities graduates completed a post-bachelor’s degree or certificate.
About nine in ten arts and communications graduates pursued their studies on a full-time basis (91%), compared with 81% of humanities graduates and 82% of all graduates.
Location of arts and communications studies
As shown in Table 1, arts and communications graduates were slightly more likely than other graduates to have pursued their studies in Quebec (28% vs. 24%) and slightly less likely to have done so in the four Atlantic provinces (4% vs. 7%). In Ontario, the four western provinces, and the three territories, the percentage of arts and communications graduates was similar to the percentage of all graduates.
Table 1 also shows that humanities graduates were much more likely than other graduates to have pursued their studies in Ontario (52% vs. 41%).

About nine in ten graduates of arts and communications programs, humanities programs, or all post-secondary programs stayed in-province for their studies (90%, 88%, and 88%, respectively). The percentages vary somewhat regarding remaining in the same city for their studies (61% of arts and communications graduates, 68% of humanities graduates, and 64% of all graduates).
Personal interest is key
By far, the most important factor in graduates’ choice of post-secondary programs is personal interest:
- 99% of arts and communications graduates and the same percentage of humanities graduates indicated that personal interest was a very or somewhat important reason in their choice of program. Similarly, 98% of all graduates cited this as a very or somewhat important reason in their choice of program.
The reputation of the post-secondary institution and the specific program were the next most important factors among arts and communications graduates:
- 91% of arts and communications graduates indicated that the reputation of the institution was a very or somewhat important reason in their choice of program (compared with 90% of humanities graduates and 91% of all graduates).
- 90% of arts and communications graduates indicated that the reputation of the specific program was a very or somewhat important reason in their choice of program (compared with 82% of humanities graduates and 87% of all graduates).
Future employment opportunities were also a significant factor in program choice, but less so for arts and communications graduates than other graduates. Future employment opportunities were selected as very or somewhat important by 84% of arts and communications graduates, 86% of humanities graduates, and 94% of all graduates.
The survey asked respondents about two other factors in their choice of program: proximity to home and recommendations from parents or friends garnered a majority of respondents but were much less important than the four previous factors. Sixty-five percent of arts and communications graduates indicated that proximity to home was very or somewhat important, while 56% said that a recommendation from a parent or friend was important.
Activities during the 12 months prior to starting their post-secondary programs
Before starting their post-secondary programs, 55% of arts and communications students and 57% of humanities students were attending school. These percentages are higher than that for all graduates (47%). Another 31% of arts and communications students and 25% of humanities students were working prior to starting their post-secondary program, compared with 37% of all students. Another 10% of arts and communications students and 11% of humanities students were both working and attending school prior to starting their post-secondary program, similar to all students (9%). The remaining students were either unemployed or captured in an “other” category. These categories combined account for 6% or less of graduates in all areas.
Prior to starting their programs, 62% of arts and communications graduates and the same percentage of humanities graduates had no post-secondary education. The percentage of all graduates having no prior post-secondary education was smaller (51%).
Only 11% of arts and communications graduates and 13% of humanities graduates had completed a bachelor’s degree prior to starting their programs that culminated in their graduation in 2009/10 (compared with 22% of all graduates in 2009/10). This reflects the lower numbers of arts and communications graduates pursuing a master’s or other advanced degree.
Twenty percent of arts and communications graduates and 17% of humanities graduates had previously completed a CEGEP or college program. These percentages are similar to that for all graduates (19%).
Very small percentages of graduates (3% or less for each level of study) had completed one of the other levels of study prior to the program that culminated in their graduation in 2009/10 (apprenticeship or trade certificate; university diploma or certificate below the bachelor’s level; university diploma or certificate above bachelor’s degree but below master’s degree; master’s degree; or doctorate).
Funding sources and debt loads of arts and communications graduates
As shown in Figure 6, parents (reported by 65% of graduates), employment savings (64%), and personal savings (59%) were the most common sources of funding for the post-secondary education of arts and communications students who graduated in 2009/10. Two other funding sources were reported by about one-half of arts and communications graduates: government student loans (50%); and scholarships, awards, or prizes (45%).

There are a few differences in sources of funding of arts and communications graduates compared with other graduates:
- Arts and communications graduates were much more likely to have received funding support from their parents (65%, vs. 54% of all graduates).
- Arts and communications graduates were more likely to have received scholarships, awards, or prizes (45%, vs. 40% of all graduates).
- Arts and communications graduates were somewhat more likely to have relied on government student loans (50%, vs. 46% of all graduates).
- Arts and communications graduates were less likely to have received support from their employer (6%, vs. 13% of all graduates).
- Arts and communications graduates were somewhat less likely to have received support from their spouse or partner (4%, vs. 8% of all graduates).
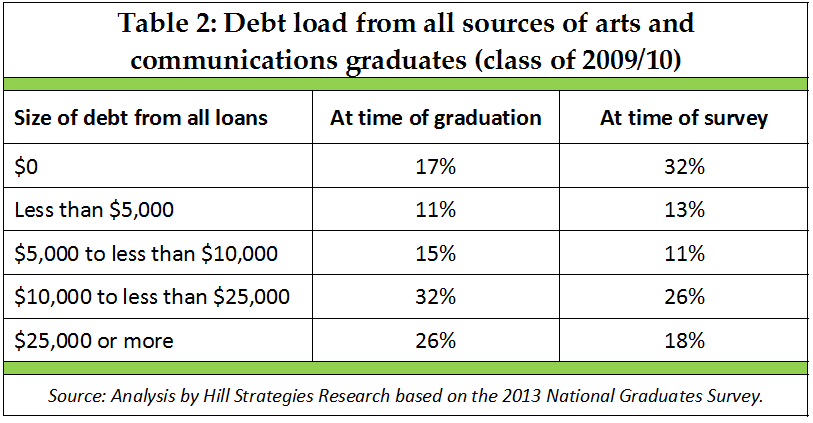
For those graduates who had borrowed money from any source for their post-secondary education, the overall debt load of arts and communications graduates at the time of their graduation in 2009/10 was fairly similar to the debt load of other graduates:
- 17% of arts and communications graduates (compared with 21% of all graduates) had no debt load at graduation.
- A similar percentage of arts and communications graduates (11%) and all graduates (10%) had a debt load (from all sources) between $1 and $4,999.
- 15% of arts and communications graduates and 13% of all graduates had a debt load between $5,000 and $9,999.
- 32% of arts and communications graduates and 29% of all graduates had a debt load between $10,000 and $24,999.
- The same percentage of arts and communications graduates and all graduates (26%) had a student debt load of $25,000 or more.
The data in Table 2 indicate that a number of arts and communications graduates had reduced their debt load in the three years between graduating and the time of the survey. In particular, the percentage of arts and communications graduates with no debt rose from 17% in 2009/10 to 32% in 2012/13. There was also a reduction in the percentage of arts and culture graduates with debt loads of $5,000 or more, as shown in the last three rows of Table 2.
Labour market activities after graduation
Respondents to the National Graduates Survey were asked about their labour force activities at the time of the survey (i.e., 2013, which was roughly three years after their graduation). Eighty-six percent of arts and communications graduates were employed at the time of their survey. This is equal to the percentage among all graduates and higher than the percentage of humanities graduates (80%). The remaining respondents were either unemployed or not in the labour force.
Among those who were employed, 76% of arts and communications graduates had full-time employment, similar to the percentage of humanities graduates (77%) but less than the percentage of all graduates (87%).
Arts and communications graduates were much more likely to have multiple jobs at the time of the survey (22%) than humanities graduates (13%) or all graduates (12%).
In terms of the occupation of the respondents’ job (or main job, if they held more than one), arts and communications graduates were:
- Much more likely than other graduates to be employed in arts, culture, recreation, or sports occupations (35% vs. 4%).
- Much more likely than other graduates to be employed in sales and service occupations (22% vs. 13%).
- Less likely than other graduates to be employed in science-related occupations (8% vs. 12%).
- Much less likely than other graduates to be employed in business, finance, and administrative occupations (13% vs. 20%).
- Much less likely than other graduates to be employed in health occupations (1% vs. 13%).
- Much less likely than other graduates to be employed in occupations in education, law or social, community, and government services (11% vs. 24%).
Seventy percent of arts and communications graduates held a permanent position at the time of the survey, a percentage that is lower than humanities graduates (72%) and all graduates (80%).
As shown in Table 3, arts and communications graduates (and humanities graduates) are much less likely than all graduates to hold a job that is closely related to their studies.

Arts and communications graduates are much more likely than other graduates to have held a low-paying position at the time of the survey: 23% of arts and communications graduates worked at a job with gross annual earnings below $20,000, compared with 15% of humanities graduates and 10% of all graduates. Another 40% of arts and communications graduates worked at a job with gross annual earnings between $20,000 and $39,999, compared with 33% of humanities graduates and 27% of all graduates.
Only 46% of arts and communications graduates indicated that the job they held at the time of the survey was the job that they had hoped to have after graduating. This is lower than the percentages of humanities graduates (52%) and all graduates (62%).
Arts and communications graduates (along with humanities graduates) are much more likely than other graduates to have had many employers in the three years since their graduation: 18% of arts and communications graduates, 14% of humanities graduates, and 8% of all graduates had four or more employers since their graduation.
A number of post-secondary graduates decide to further their studies after graduation. Between 2010 and 2013, this was the case for 45% of arts and communications graduates, 62% of humanities graduates, and 41% of all graduates.
Respondents were asked, on a scale of 1-10, how they felt about life as a whole at the time of the survey. Arts and communications graduates were less likely than other graduates to be very satisfied with their life (i.e., response of 9 or 10). This was the case for 26% of arts and communications graduates, 29% of humanities graduates, and 34% of all graduates.
Despite the labour market challenges noted above, 72% of recent arts and communications graduates would choose the same program of studies again. This is equal to the percentage of humanities graduates (72%) and only slightly less than the percentage of all graduates (76%).

Section 5: Conclusions
Limited overlap between visual and performing arts graduates and working as an artist
One of the key findings of a recent American report[7] was that there was a “surprising” lack of overlap between working artists and arts graduates. In that study, 16% of artists were art graduates, and 10% of arts graduates were found to be artists.
While the American study used different definitions of “artists” and “arts graduates”, the findings from our Canadian research are relatively similar, especially regarding the occupations of arts graduates:
- 28% of the 134,500 Canadian artists 25 or older graduated from a post-secondary visual or performing arts program.
- 11% of the 326,300 visual and performing arts graduates who were in the labour force in May of 2011 worked as artists.
The overlap between visual and performing arts graduates and working artists is depicted in Figure 7.

Signs of underemployment of recent arts and communications graduates
While the data in this report are not definitive, recent arts and communications graduates may be underemployed compared with other recent post-secondary graduates. In particular, arts and communications graduates are much less likely than all graduates to hold a job that is closely related to their studies (36% vs. 58%). Similarly, only 46% of arts and communications graduates indicated that the job they held at the time of the survey was the job that they had hoped to have after graduating, compared with 62% of all graduates.
Furthermore, arts and communications graduates are much more likely than other graduates to have held a low-paying position at the time of the survey: 23% of arts and communications graduates worked at a job with gross annual earnings below $20,000, compared with 10% of all graduates. Arts and communications graduates are much more likely than other graduates to be employed in sales and service occupations (22% vs. 13%).
Arts and communications graduates are also much more likely than other graduates to have had many employers in the three years since their graduation: 18% of arts and communications graduates (vs. 8% of all graduates) had four or more employers since their graduation.
Despite these labour market challenges, 72% of recent arts and communications graduates would choose the same program of studies again. This is only slightly less than the percentage of all graduates (76%).
Suggestions for future research
This report has examined data from Statistics Canada’s National Household Survey and National Graduates Survey regarding the educational backgrounds of artists and the labour market situations of arts program graduates.
The research for this report has relied upon readily-available datasets and their groupings of educational programs. This has led to certain limitations. Specifically, the data on recent arts graduates were based on an aggregated combination of educational programs developed by Statistics Canada. The closest grouping for “arts graduates” was those who graduated from a visual or performing arts program as well as those who graduated from a communications technology program at the post-secondary level. The inclusion of communications technology programs was not ideal for the analysis.
Future research could examine more specifically the labour market outcomes of arts graduates (including variations in income levels) and pinpoint arts graduates more specifically than the aggregate grouping used in parts of this report (i.e., “arts and communications” graduates).
Further research regarding the educational backgrounds of working artists could examine differences in artists’ incomes by educational program and information about the education and career paths of the 23% of artists who have not completed a post-secondary program. (This is the second-largest contingent of artists, behind the 28% of artists who completed a visual or performing arts program.)
[1] Artists Report Back: A National Study on the Lives of Art Graduates and Working Artists, BFAMFAPHhD, 2014 (http://bfamfaphd.com/) and Making It Work: The Education and Employment of Recent Arts Graduates, by Jennifer C. Lena, Strategic National Arts Alumni Project, 2014 (http://snaap.indiana.edu/usingSNAAPData/valueForTheField/reports.cfm). Labour market outcomes of arts and culture graduates, Jacqueline Luffman, Focus on Culture, Vol. 12 No 3, Statistics Canada, 2001.
[2] Artists Report Back: A National Study on the Lives of Art Graduates and Working Artists, BFAMFAPHhD, 2014 (http://bfamfaphd.com/) and Making It Work: The Education and Employment of Recent Arts Graduates, by Jennifer C. Lena, Strategic National Arts Alumni Project, 2014 (http://snaap.indiana.edu/usingSNAAPData/valueForTheField/reports.cfm). Labour market outcomes of arts and culture graduates, Jacqueline Luffman, Focus on Culture, Vol. 12 No 3, Statistics Canada, 2001.
[3] Classification of Instructional Programs (CIP) Canada 2011, Statistics Canada, 2012, http://www23.statcan.gc.ca/imdb/p3VD.pl?Function=getVD&TVD=127939&CVD=127940&CPV=50.&CST=01012011&CLV=1&MLV=3, viewed April 30, 2015.
[4] Classification of Instructional Programs (CIP) Canada 2011, Statistics Canada, 2012, http://www23.statcan.gc.ca/imdb/p3VD.pl?Function=getVD&TVD=127939&CVD=127940&CPV=50.&CST=01012011&CLV=1&MLV=3, viewed April 30, 2015.
[5] Programs included in this category are: Photographic and film/video technology/technician and assistant; Radio and television broadcasting technology/technician; Recording arts technology/technician; and Audiovisual communications technologies/technicians, other. Classification of Instructional Programs (CIP) Canada 2011, Statistics Canada, 2012, http://www23.statcan.gc.ca/imdb/p3VD.pl?Function=getVD&TVD=127939&CVD=127941&CPV=10.02&CST=01012011&CLV=2&MLV=3, viewed May 28, 2015.
[6] Programs included within communications technologies are: Communications technology/technician; Audiovisual communications technologies/technicians; Graphic communications; and Communications technologies/technicians and support services, other. Classification of Instructional Programs (CIP) Canada 2011, Statistics Canada, 2012, http://www23.statcan.gc.ca/imdb/p3VD.pl?Function=getVD&TVD=127939&CVD=127940&CPV=10.&CST=01012011&CLV=1&MLV=3, viewed May 28, 2015.
[7] Artists Report Back: A National Study on the Lives of Art Graduates and Working Artists, BFAMFAPHhD, 2014 (http://bfamfaphd.com/).
Full Report
Other Resources
http://hillstrategies.com/wp-content/uploads/2015/06/Educating_artists_ExecSumm_1.pdf
